- CLIENT: Microsoft AI Architecture & Strategy
- ROLE: Product Design
- Conceptual Design
- User Research
- Personas & User Flows
- Information Architecture
- Heuristic Assessment
- Wireframing
- Rapid Prototyping
- User Testing
- Style Guide & Hi-Fi Comps
- Rapid Prototyping
- Front End Development
- Delivery and Integration Support
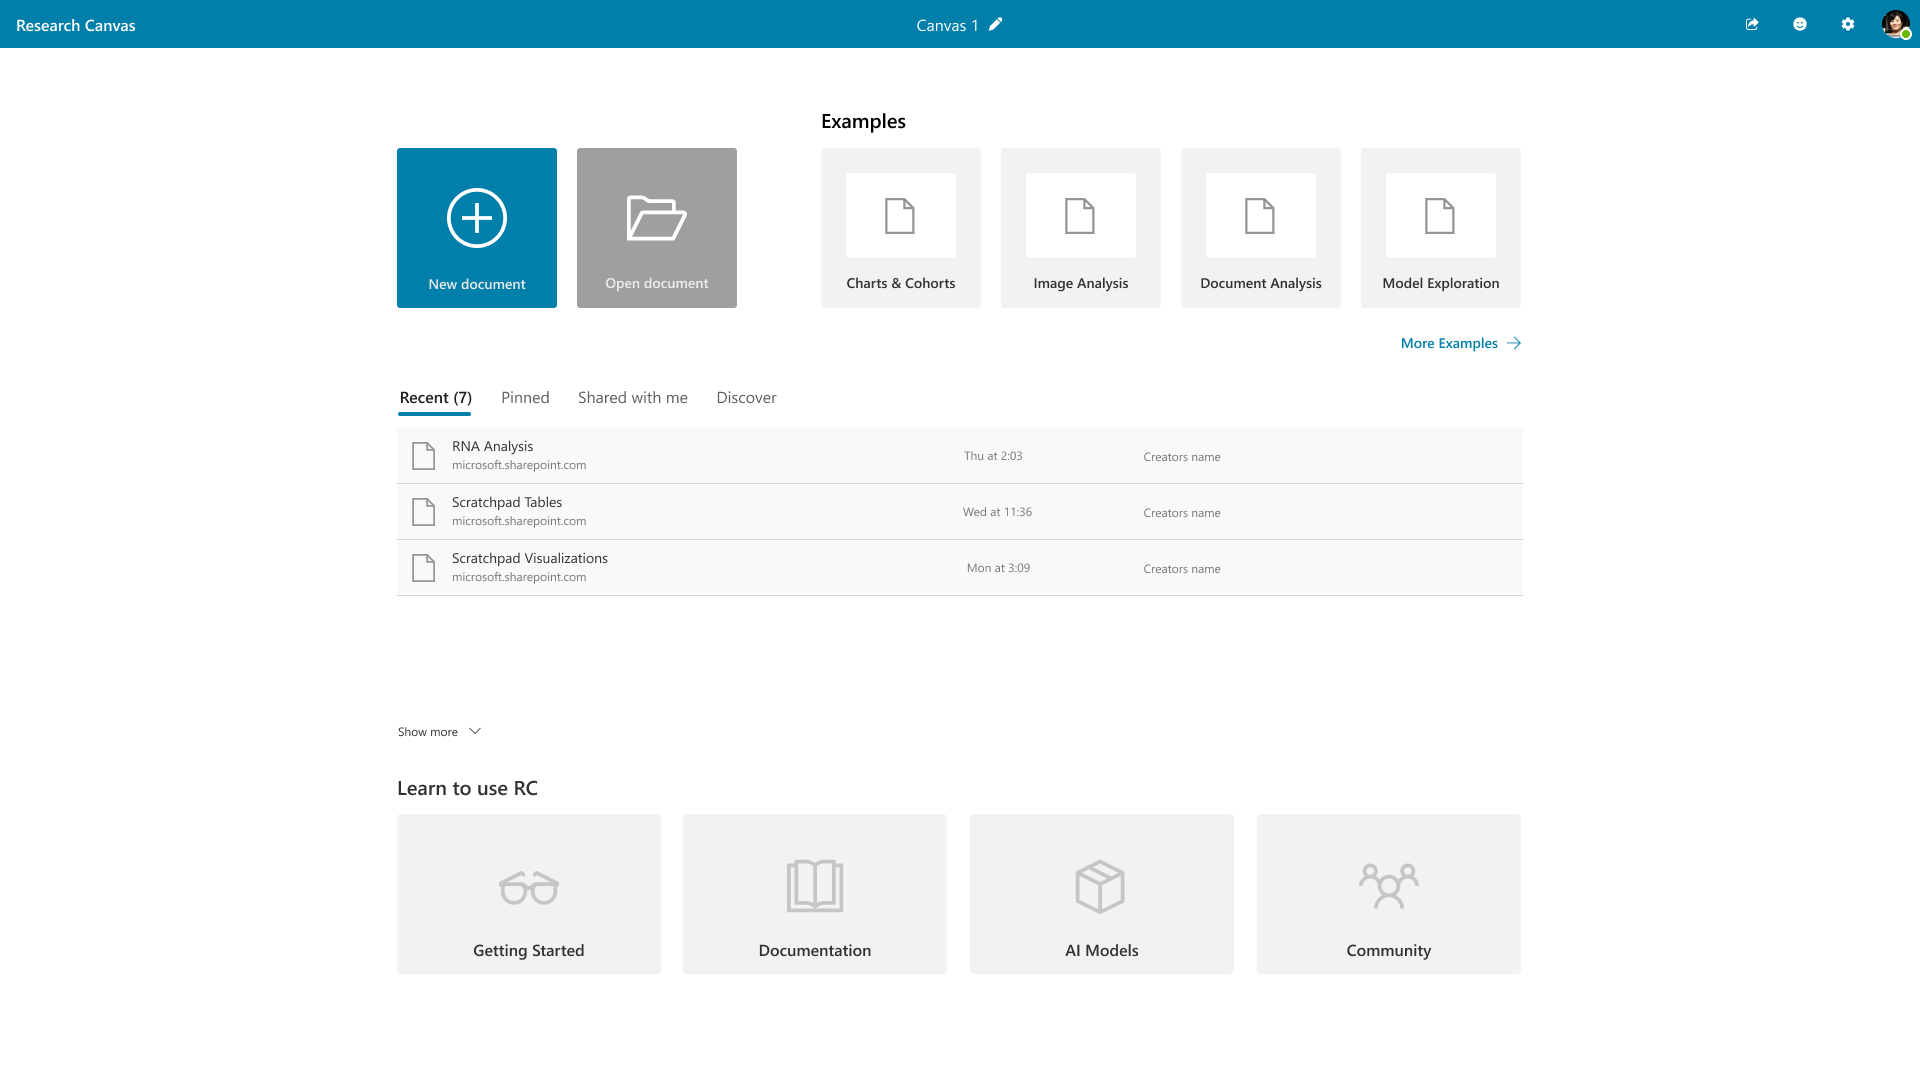
Overview
What if you could take petabytes of data and have an AI scan and pull salient details to surface the best path forward for research?
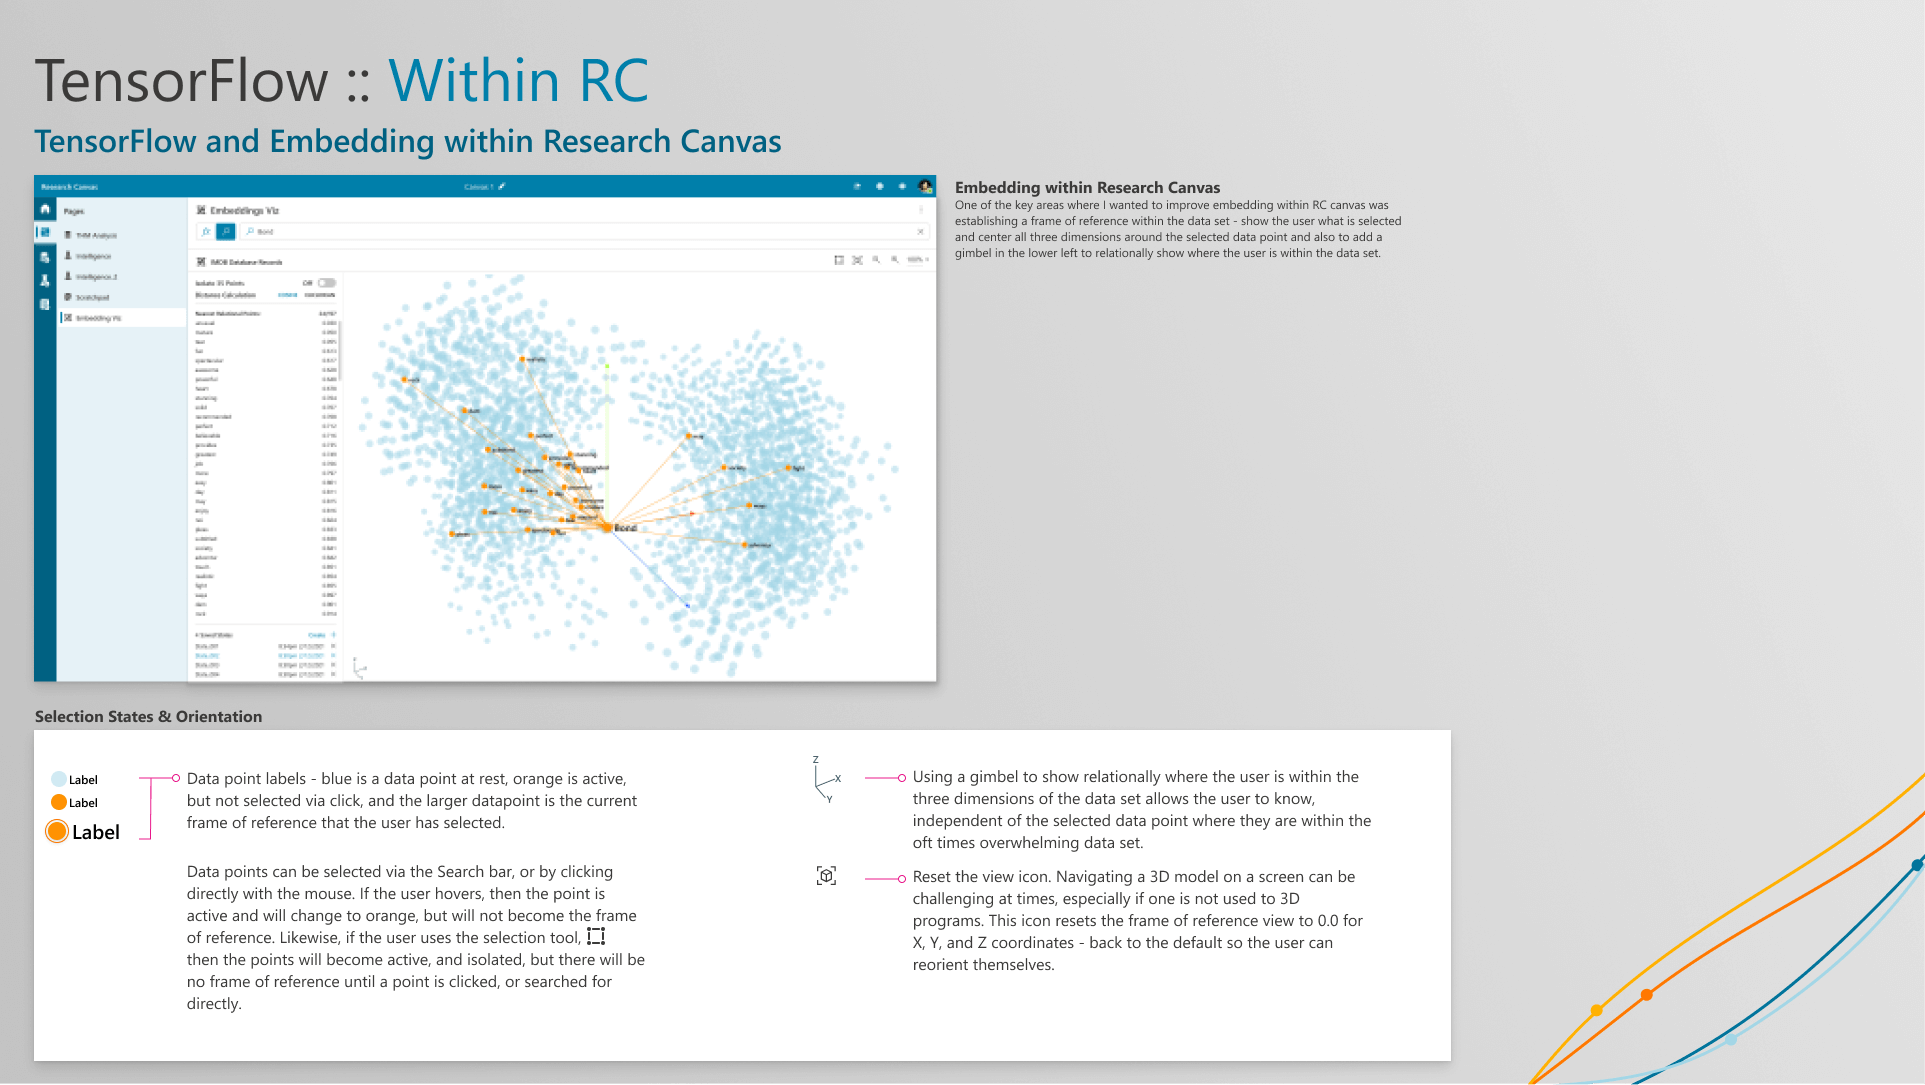
Research Canvas does exactly that. As part of a six person design team with Microsoft AI Architecture & Strategy, I led the visualization aspect of Research Canvas, giving clients from diverse industries such as fintech to medical research, a framework for any chart style, 2D, 3d or even tensor Flows, to visualize the data and identify underlying patterns.
Problems & Opportunities
In the ever-evolving landscape of data-driven research, Microsoft R&D sought to transform the way researchers interact with vast amounts of data. The goal was to create Research Canvas - a platform capable of converting petabytes of information into a searchable database enriched with dynamic visualizations. As part of the UX team, I was tasked with designing interactive visualizations, including tensorFlow, 2D graphs, and 3d graphs. This case study outlines the research, design, and implementation of these visualizations, showcasing their impact on user experience and efficiencies in data exploration.
Project Goals
- Create a user-friendly interface for navigating vast petabytes of data.
- Provide tools for dynamic visualizations that enhance understanding.
- Enable real-time, on-the-fly generation of 2D and 3d graphs.
- Support tensorFlow integration for advanced analytics.
Stakeholder Interviews
I began by conducting interviews with researchers, data scientists, and potential users of Research Canvas. Key themes emerged:
- Users desire intuitive navigation tools that do not require deep technical expertise.
- Customization options for visualizations are crucial to meet diverse research needs.
- The ability to manipulate data in real-time fosters exploratory data analysis.

Research
I began by conducting interviews with researchers, data scientists, and potential users of Research Canvas. Key themes emerged:
- Users desire intuitive navigation tools that do not require deep technical expertise.
- Customization options for visualizations are crucial to meet diverse research needs.
- The ability to manipulate data in real-time fosters exploratory data analysis.
Competitive Analysis
II analyzed similar platforms, focusing on strengths and weaknesses in their visualization tools. The research highlighted:
- Most platforms lacked interactive elements that allow users to drill down into data.
- Complicated user interfaces detracted from the core purpose of data exploration.
User Personas
Developing user personas helped clarify the primary audience for Research Canvas:
1. Data Scientists: Require in-depth analysis and flexibility in visualizations.
2. Academic Researchers*: Value intuitive navigation and quick insights.
3. Business Analysts: Seek straightforward visualizations to support quick decision-making.
Product Flow
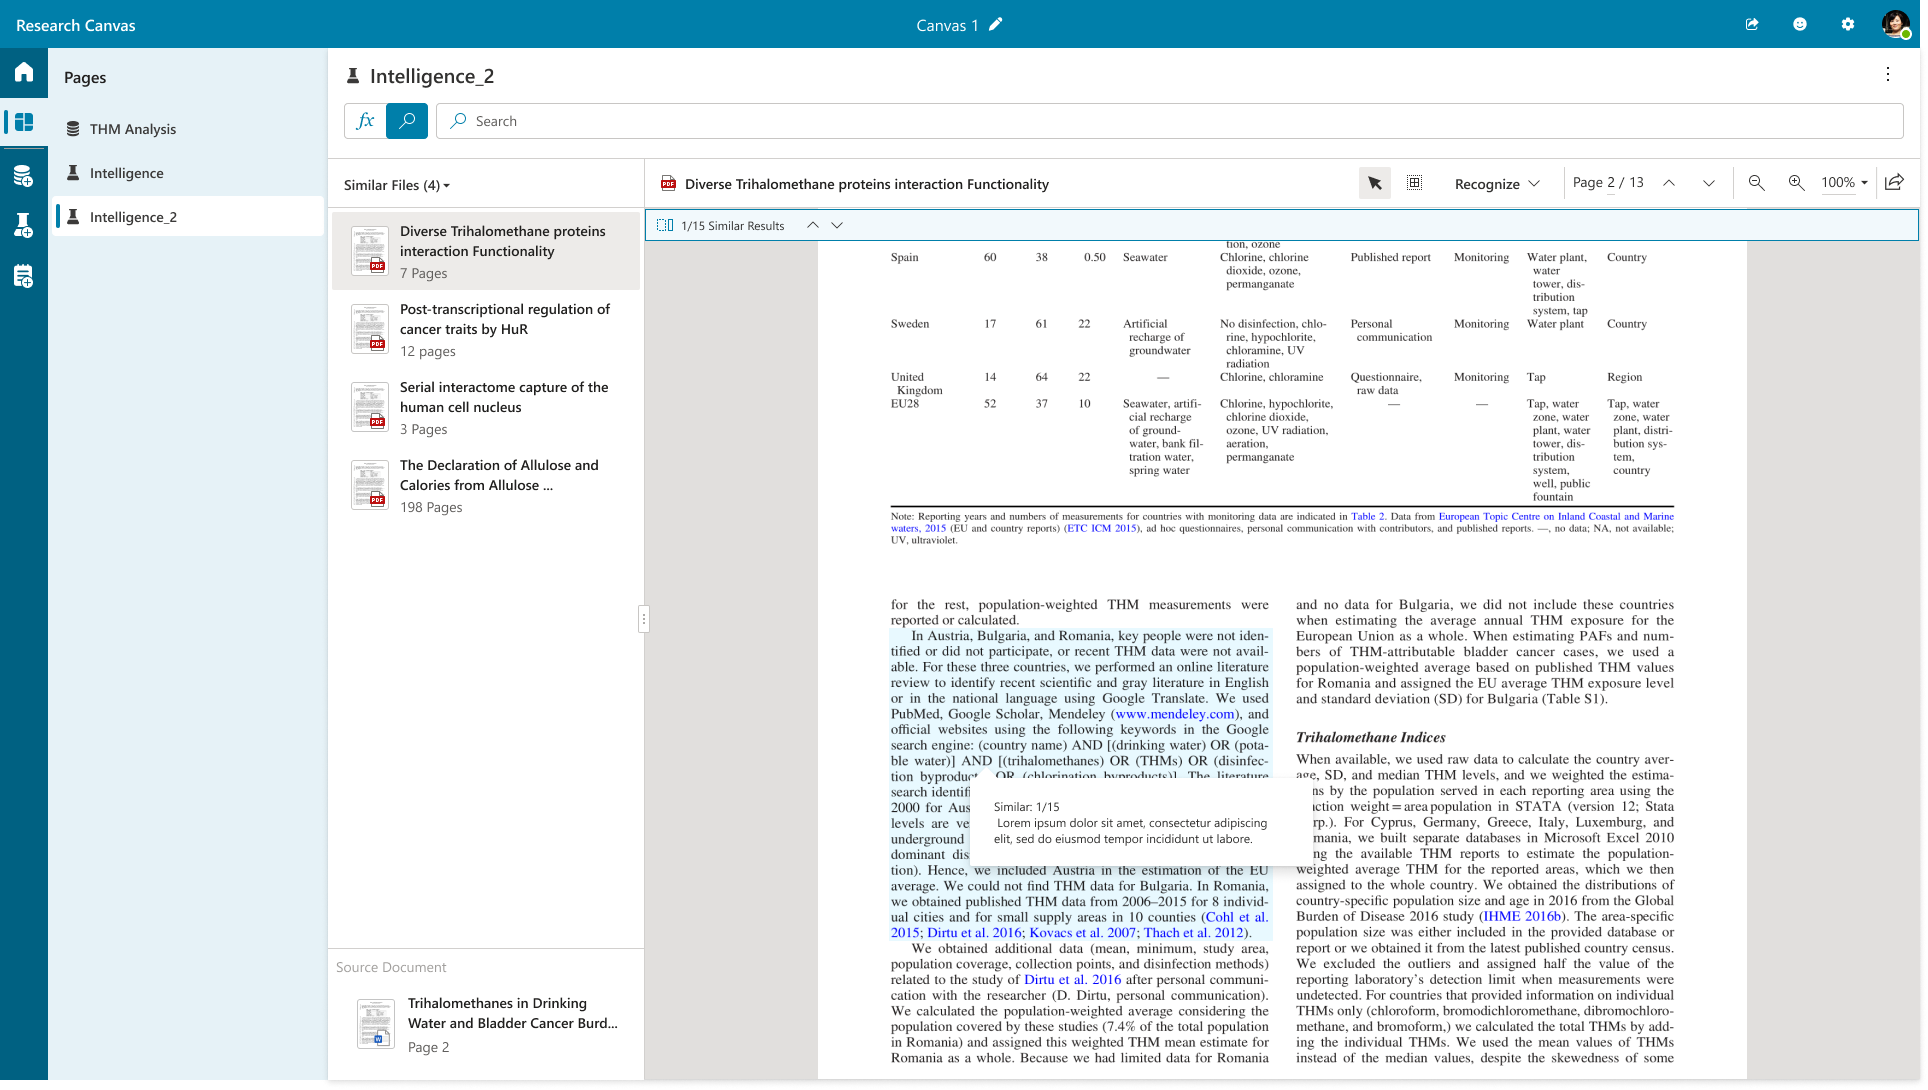
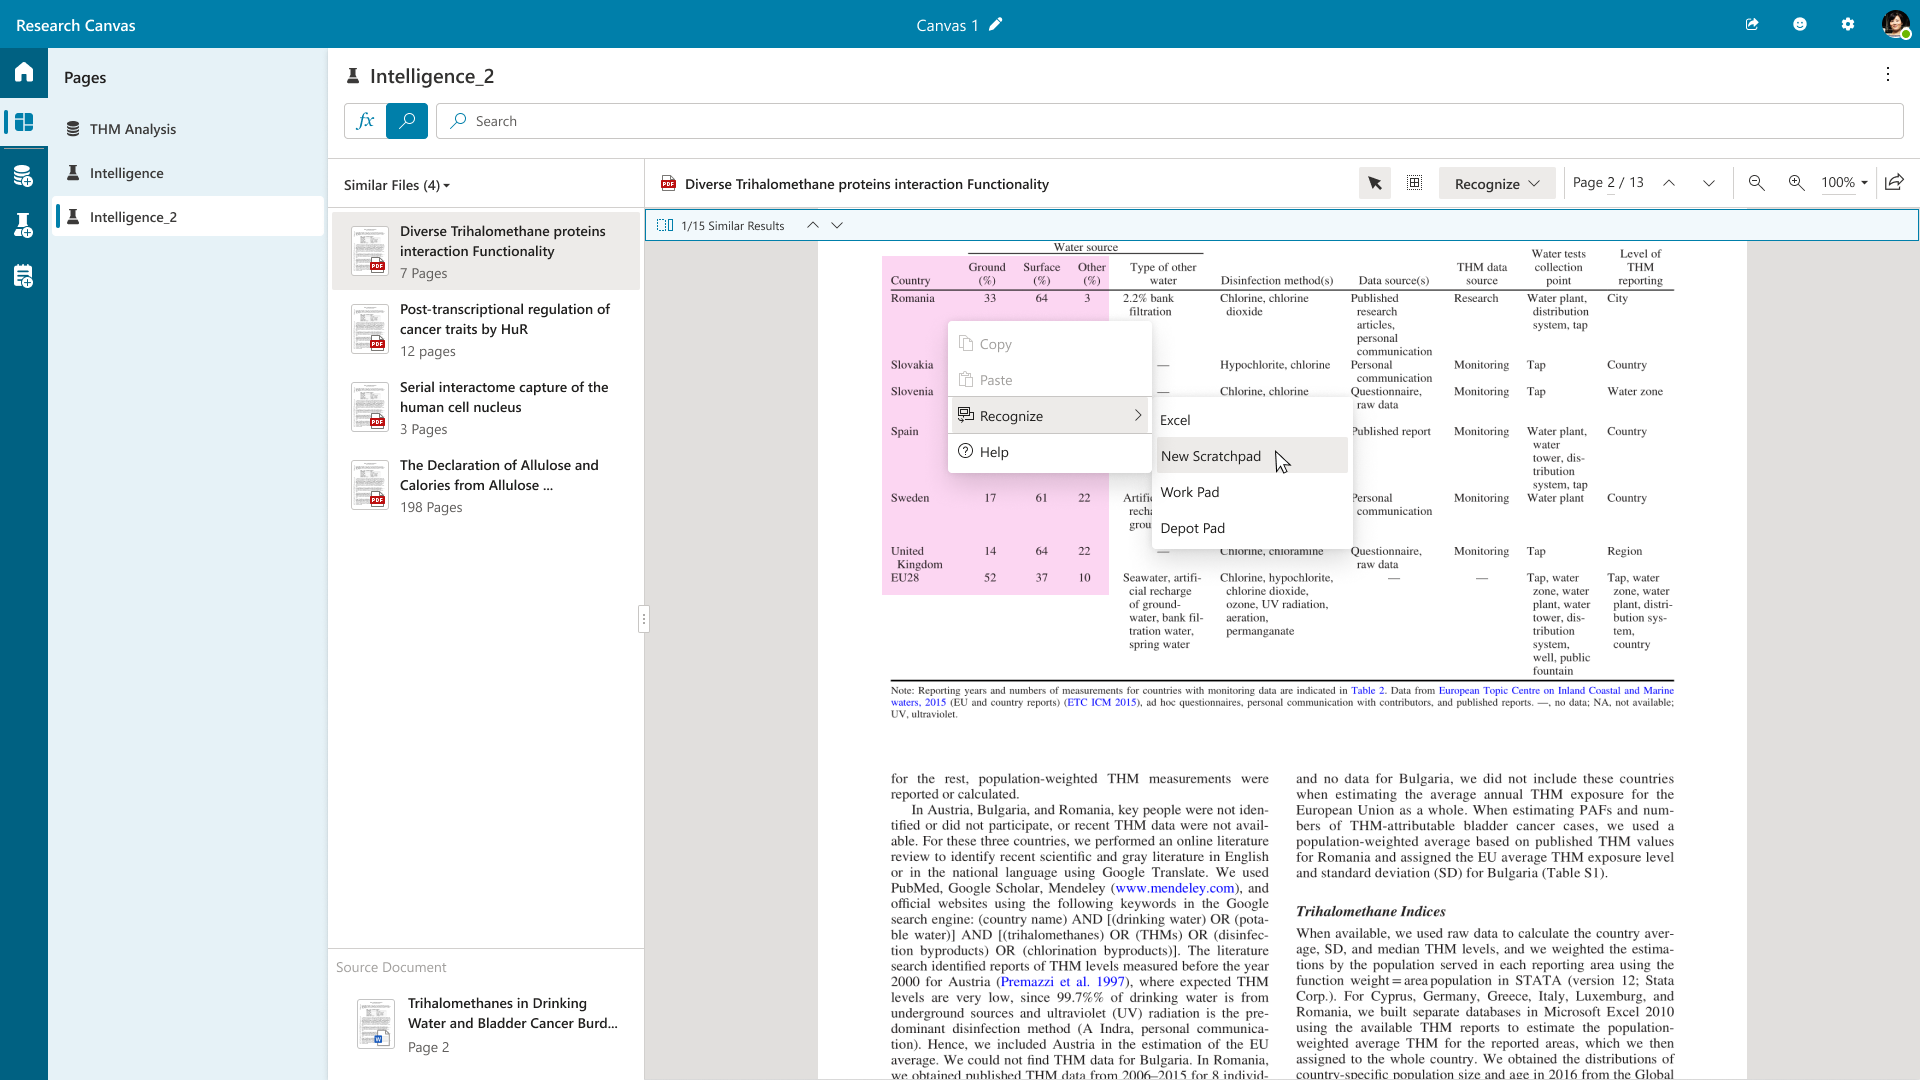
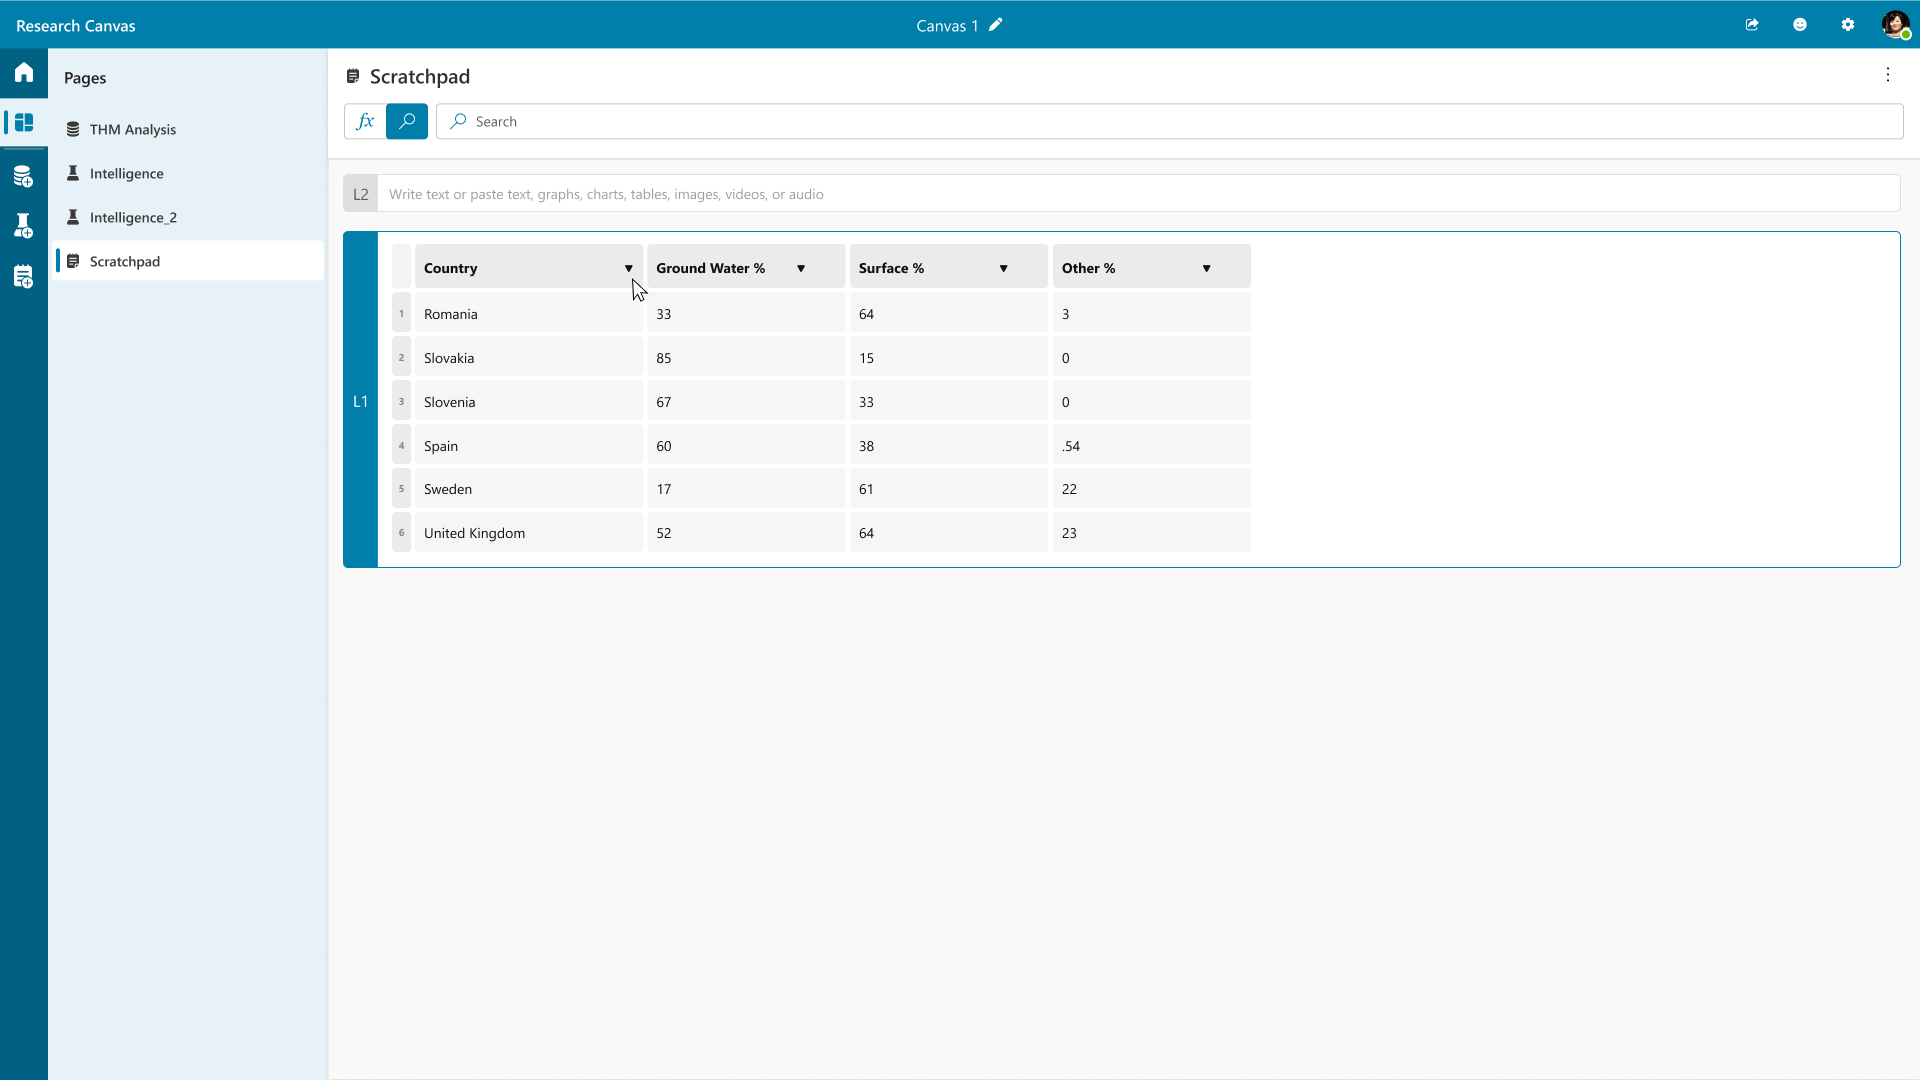
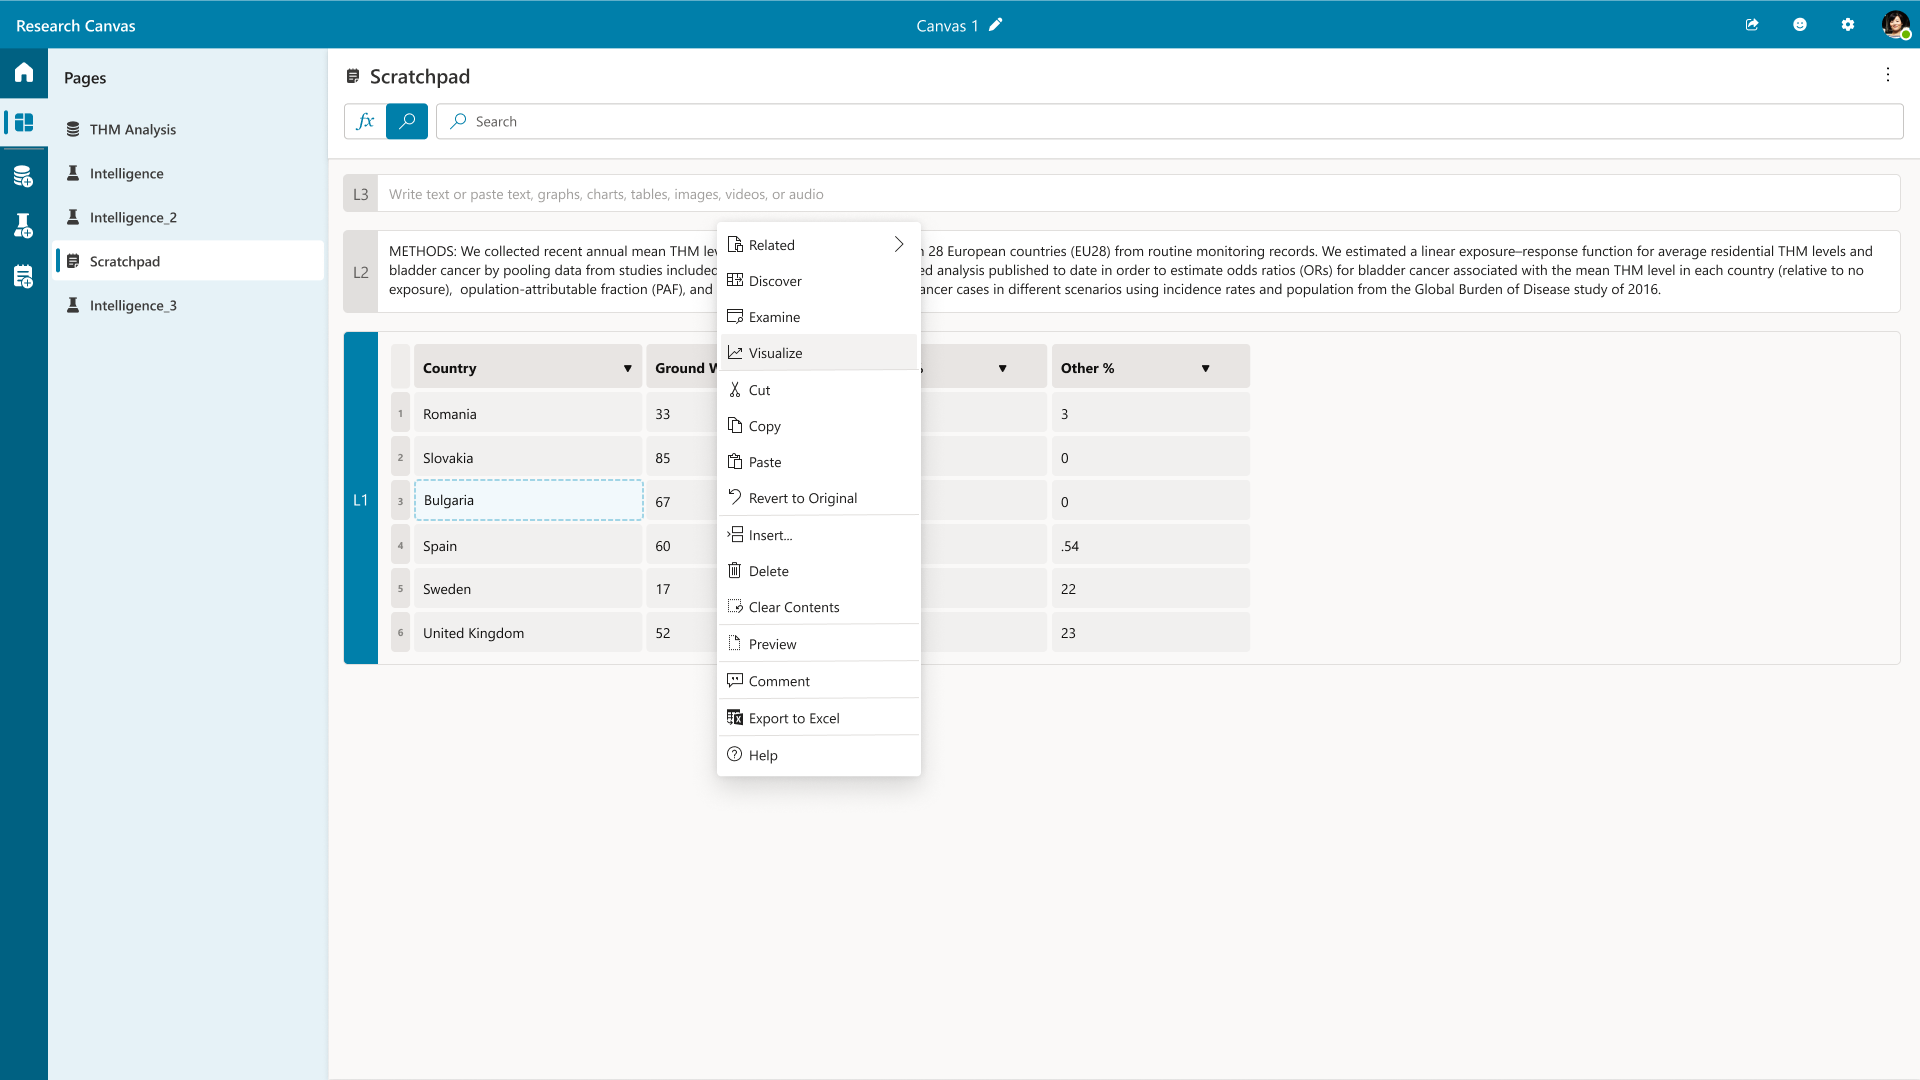
Research Canvas transforms the challenge of handling petabytes of research data into a streamlined process by ingesting a multitude of formats such as research papers and datasets, which are then indexed and normalized for easy access.
Researchers can search the centralized database using keywords and filters to locate relevant materials, examine findings through an interactive text view, and extract key data into structured tables. They can subsequently build customizable graphs—such as bar or scatter plots—using these extracted metrics, benefiting from real-time visualization generation.
This dynamic platform allows researchers to quickly uncover insights, create compelling visual narratives, and make informed decisions, significantly enhancing their overall research experience.


Research
Research for the UX of Research Canvas was conducted through a comprehensive approach involving both qualitative and quantitative methods. We began with stakeholder interviews and surveys to gather insights from a diverse group of users, including researchers, data scientists, and academics, to understand their needs, workflows, and challenges with existing data management and visualization tools. This was supplemented by usability testing with low-fidelity wireframes to gauge initial interactions and design intuitiveness. We also facilitated hands-on workshops where participants could interact with high-fidelity prototypes, providing valuable feedback on specific features. Observational studies in research settings further illuminated the real-world context in which users engage with data. By triangulating findings from these methods, we were able to create a user-centered design that effectively addressed the specific needs of the research community.


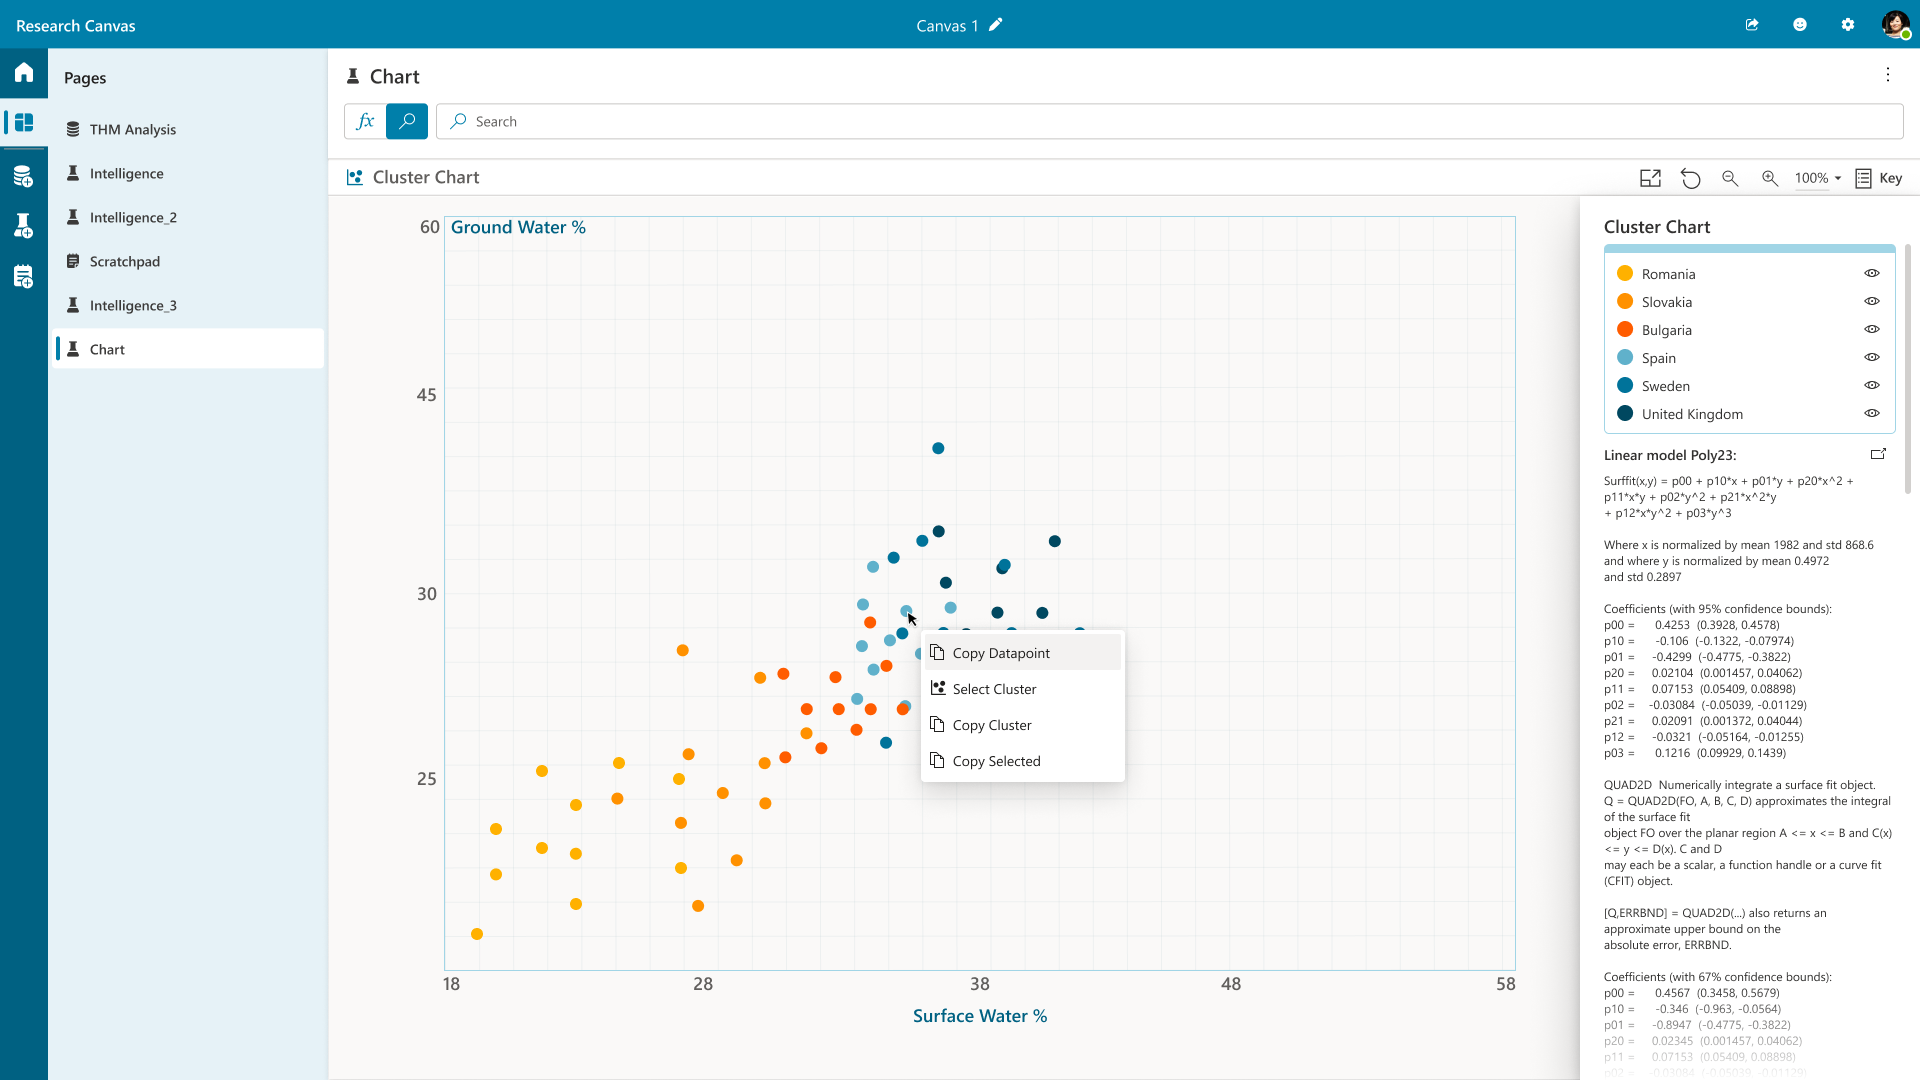
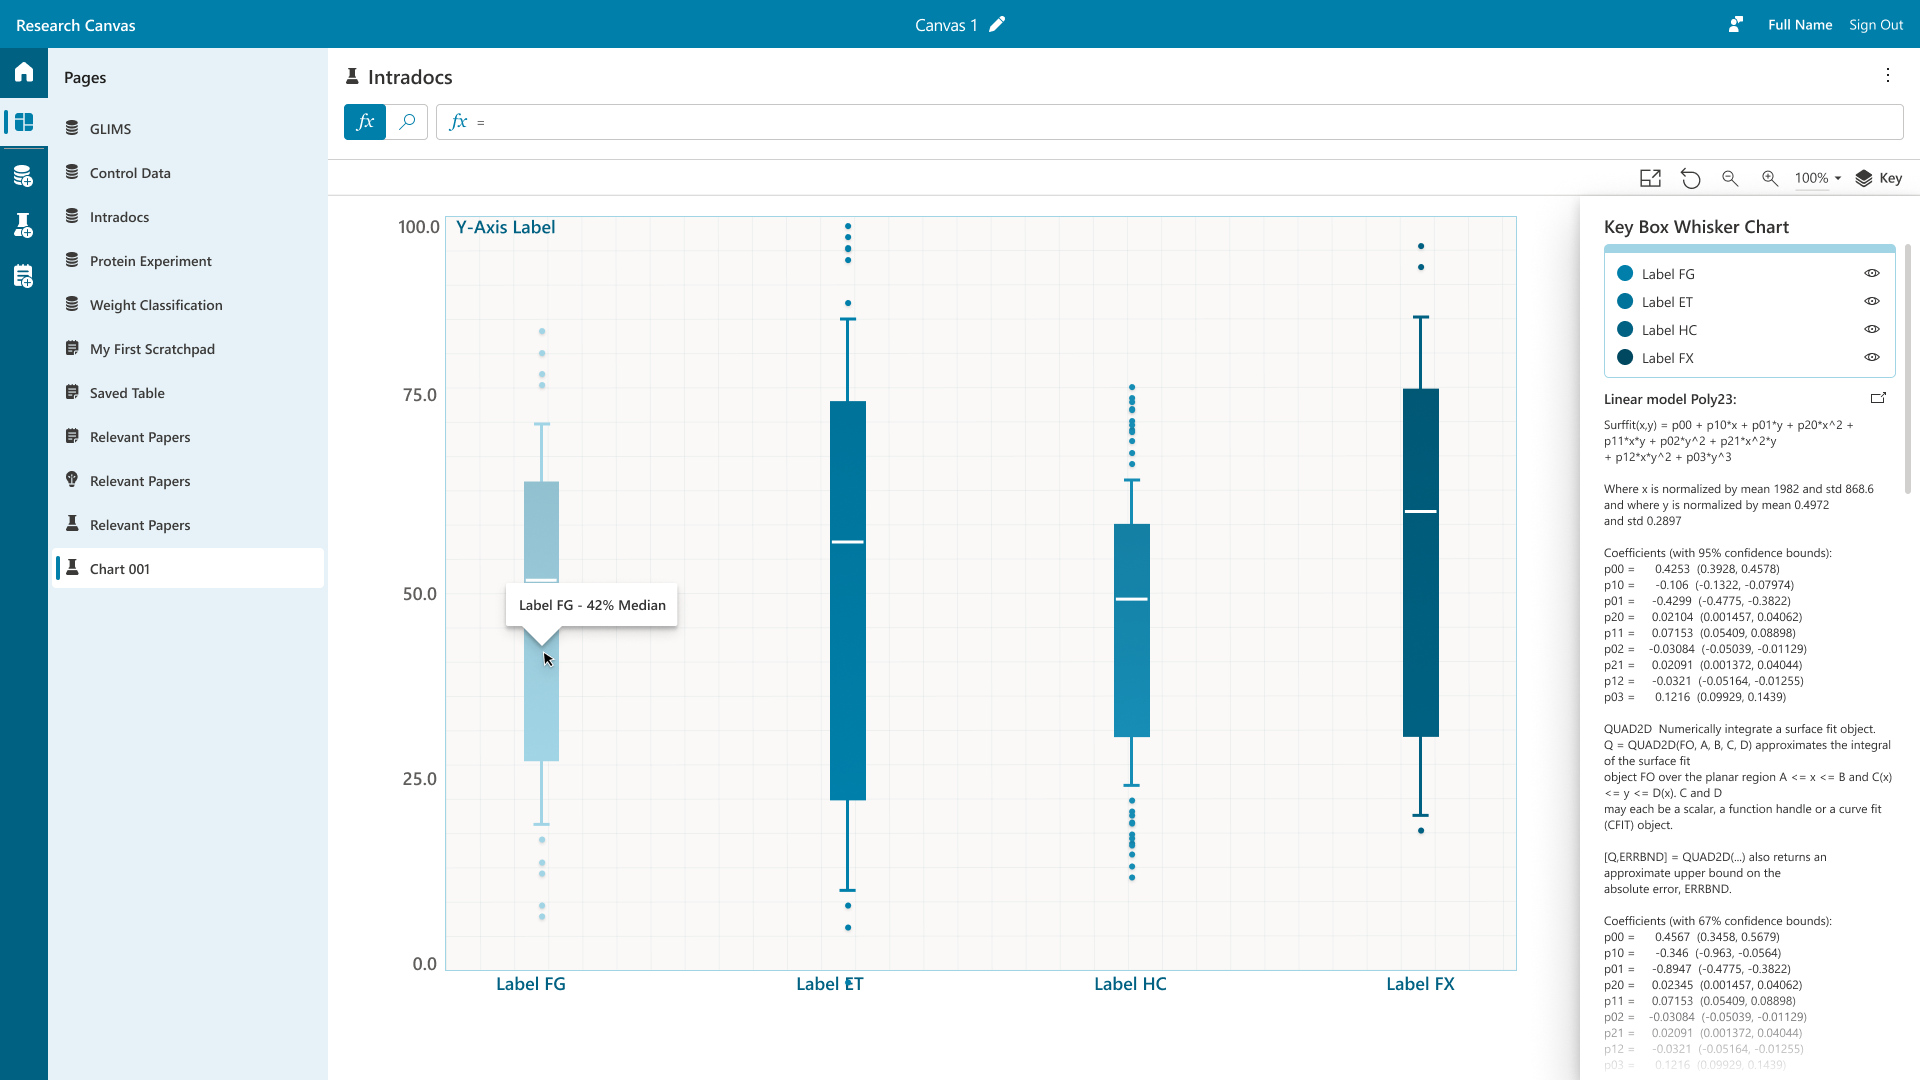
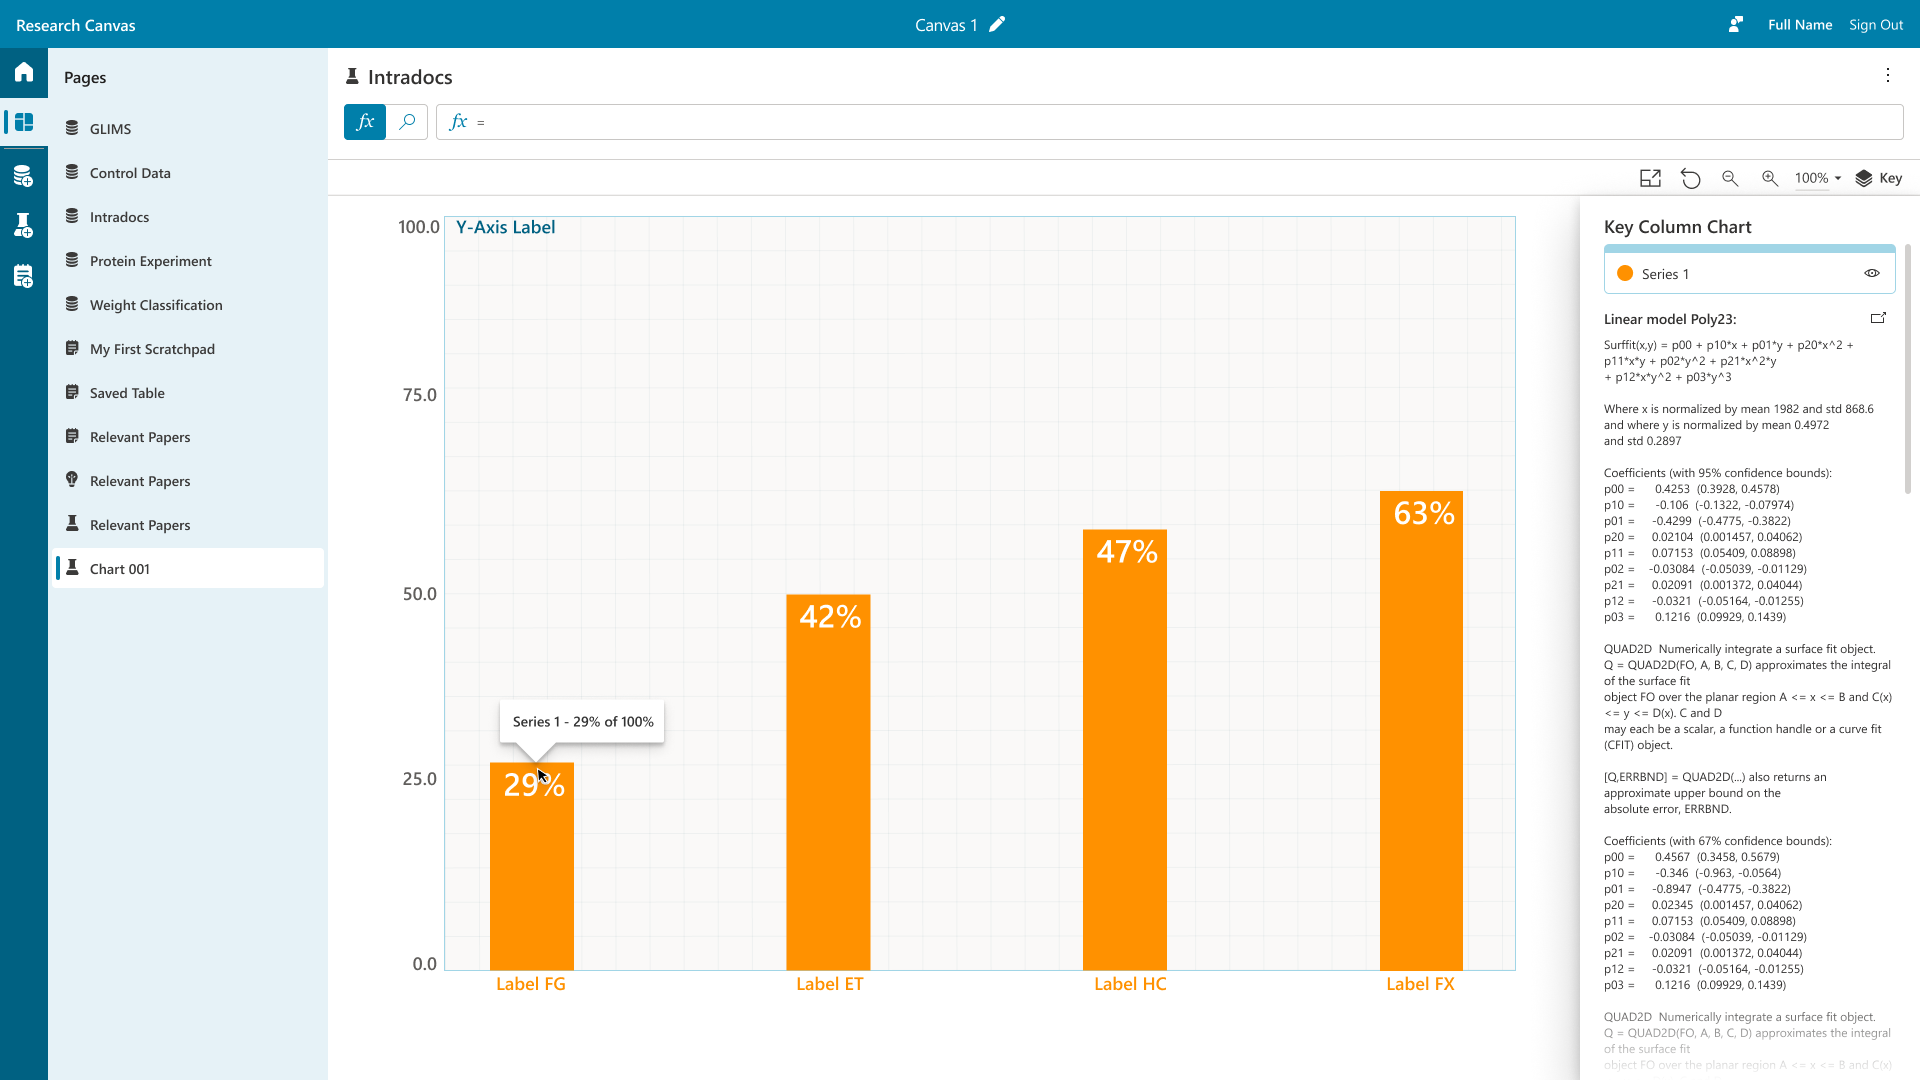
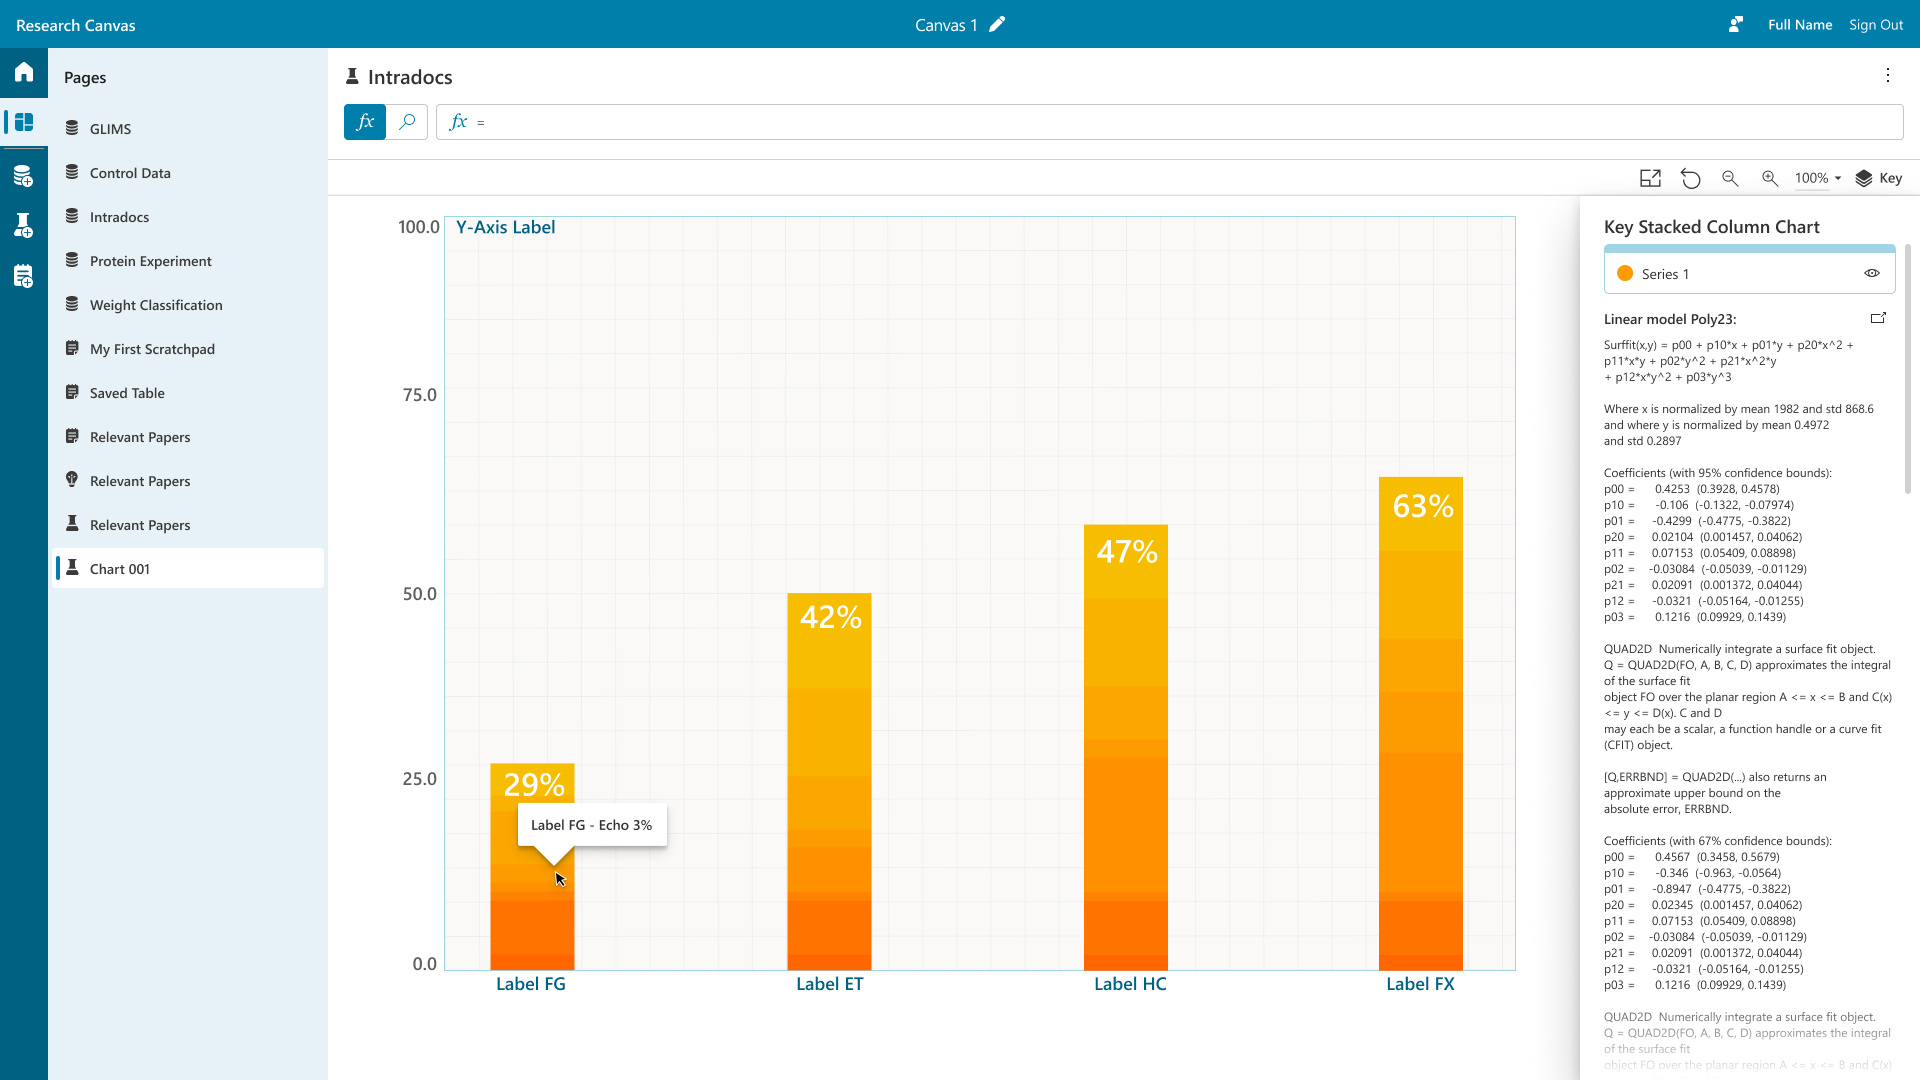
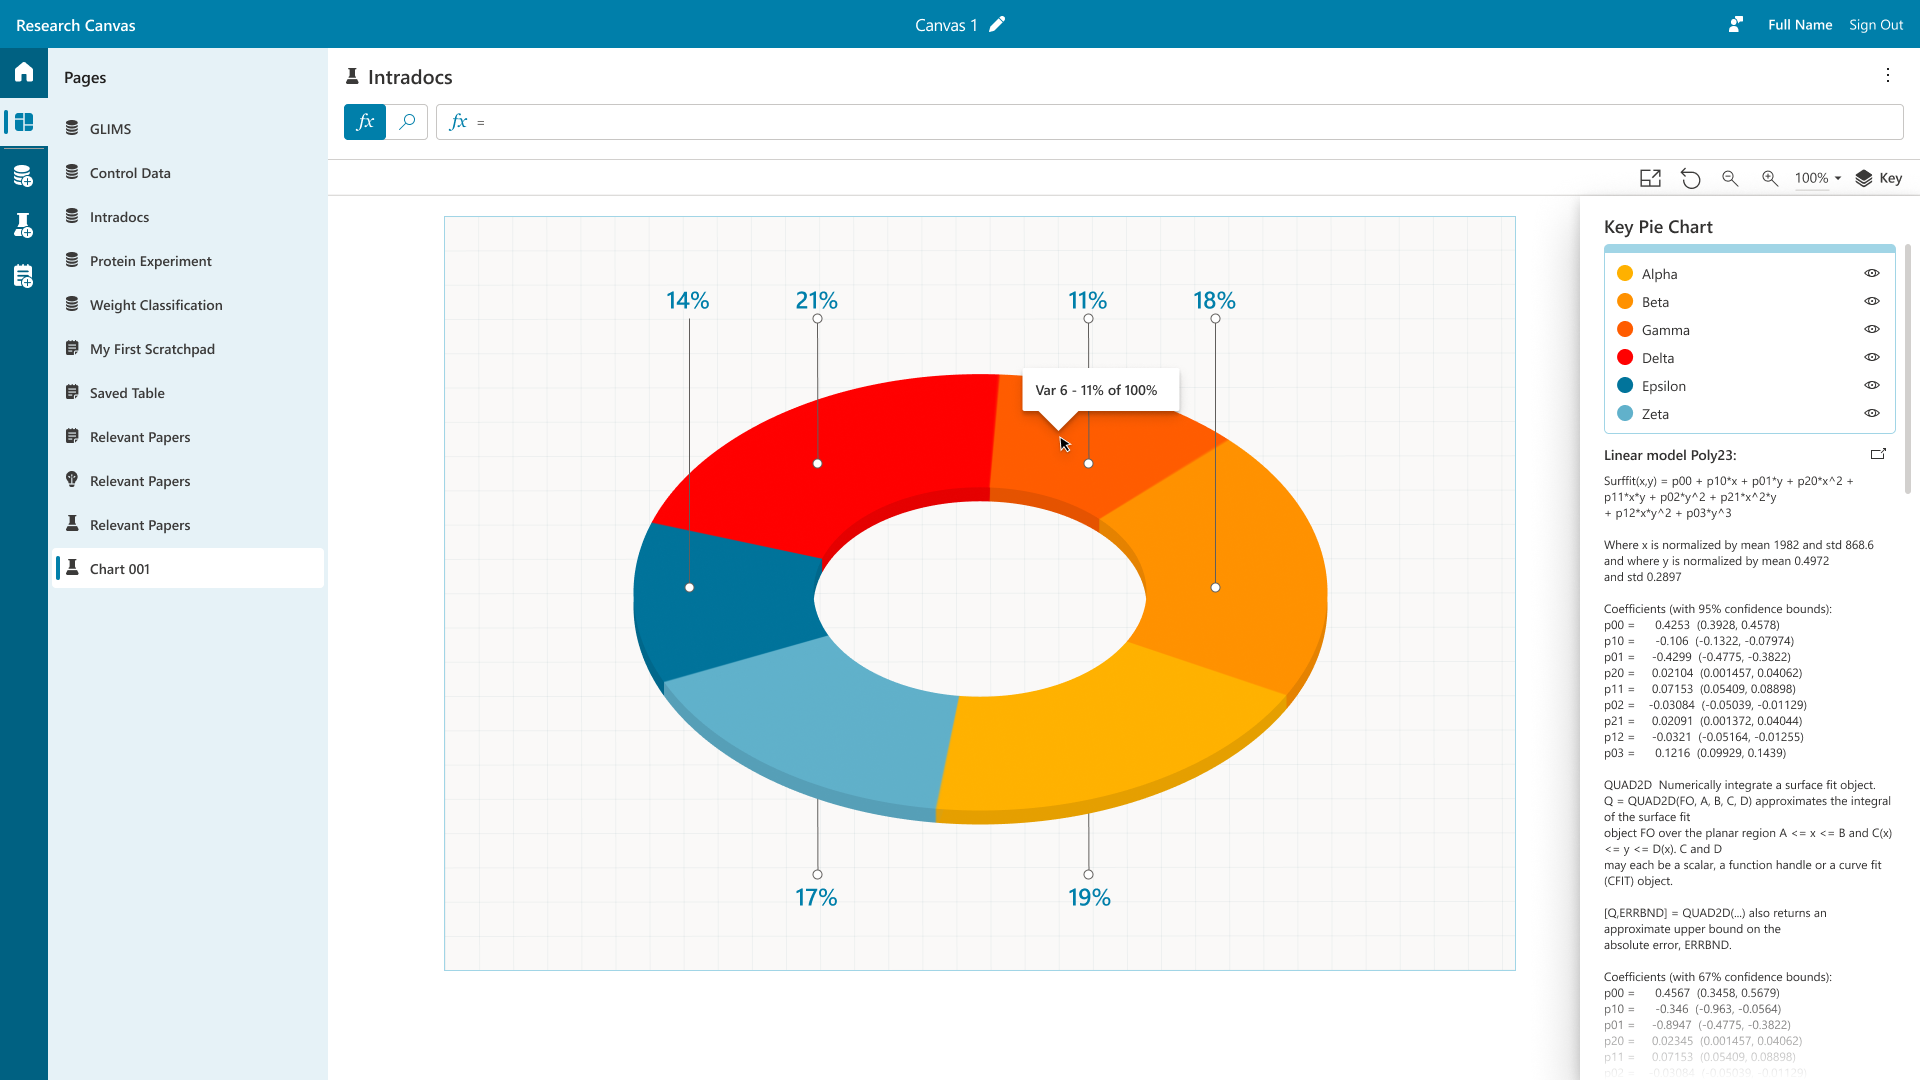
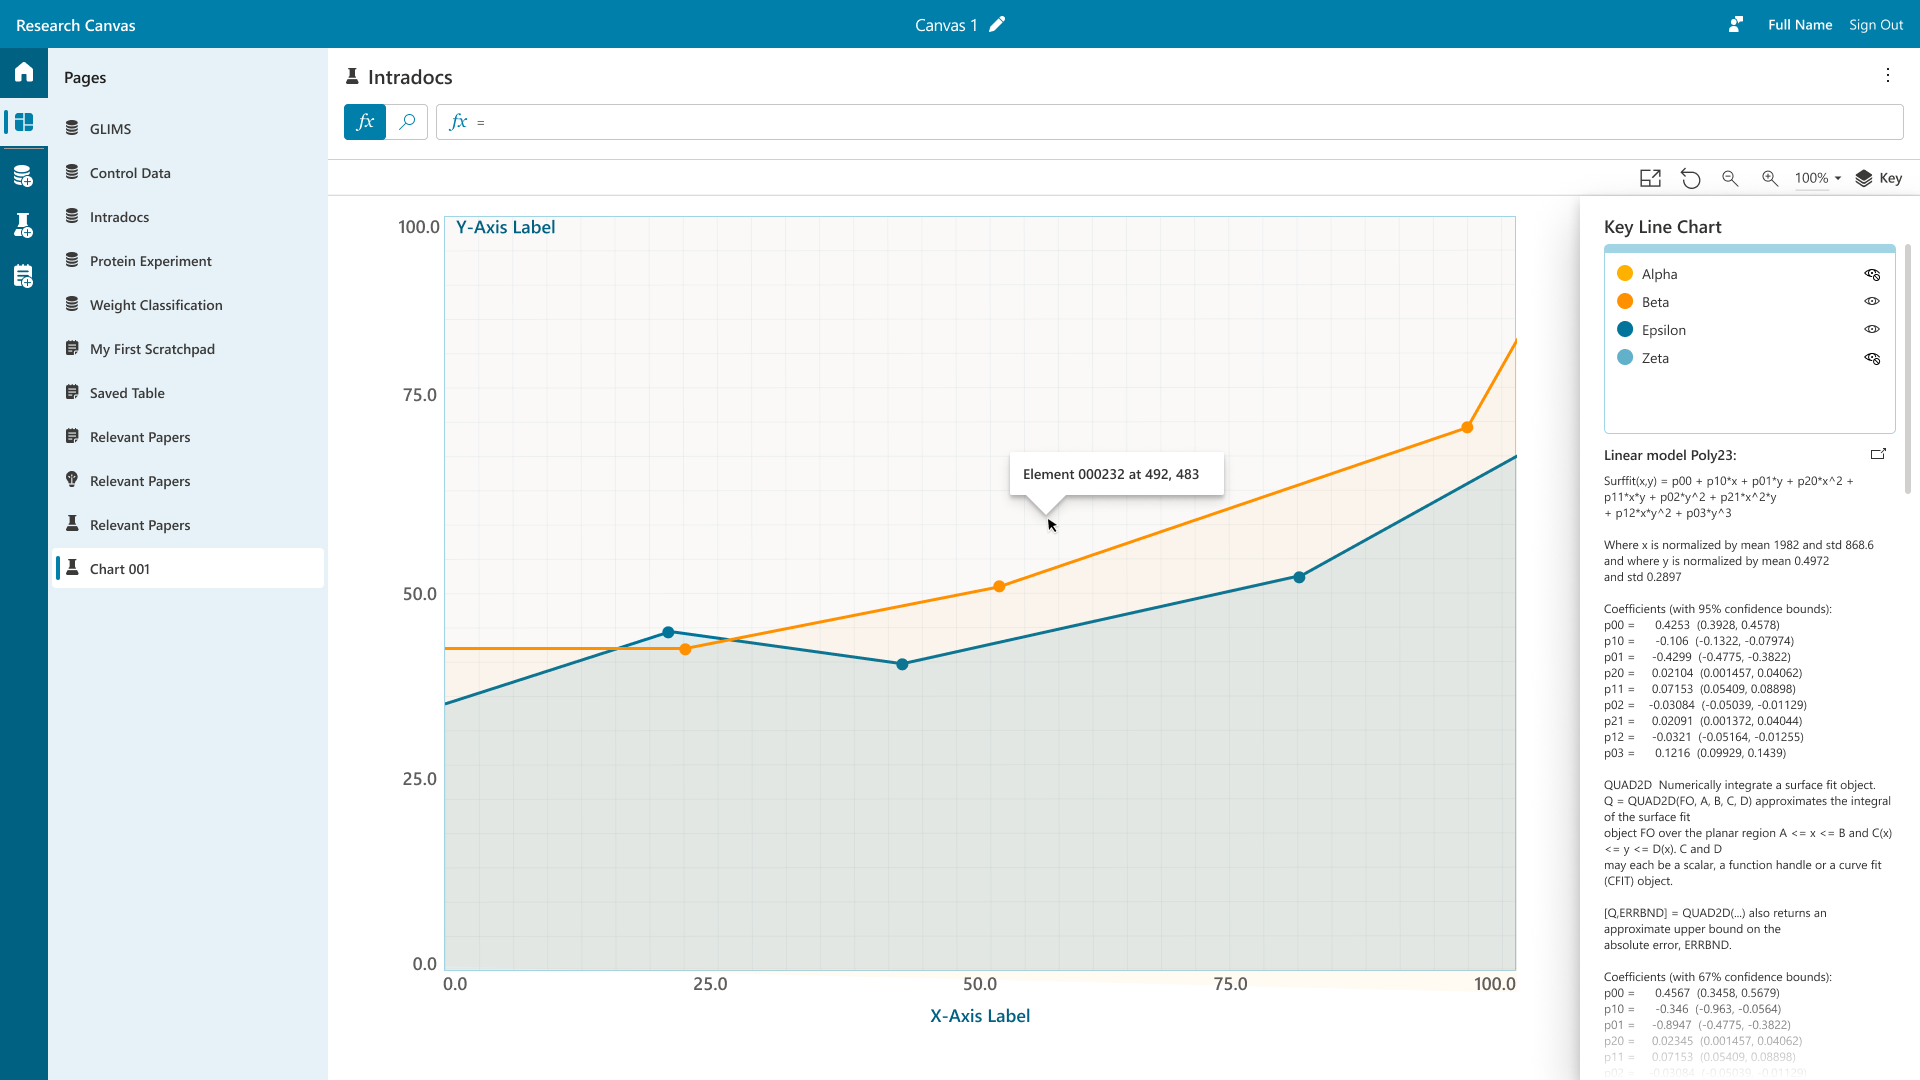
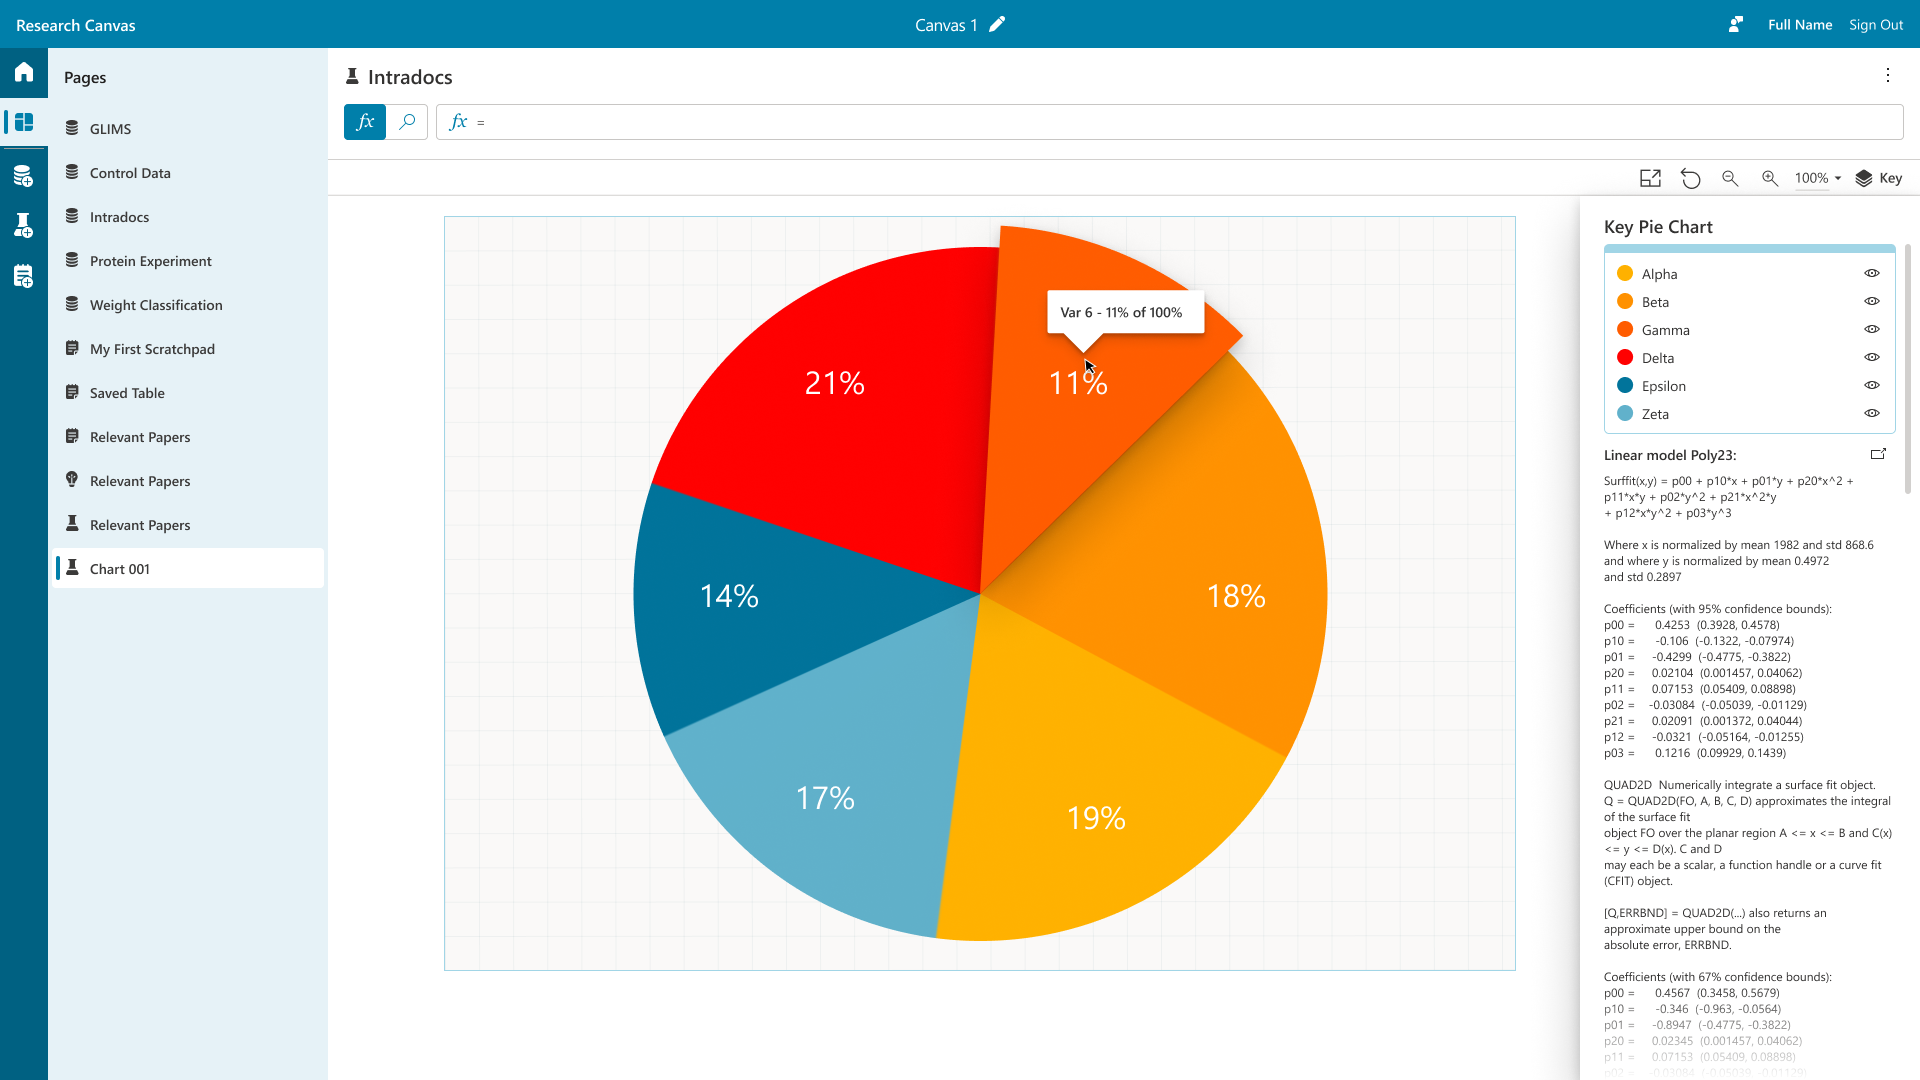
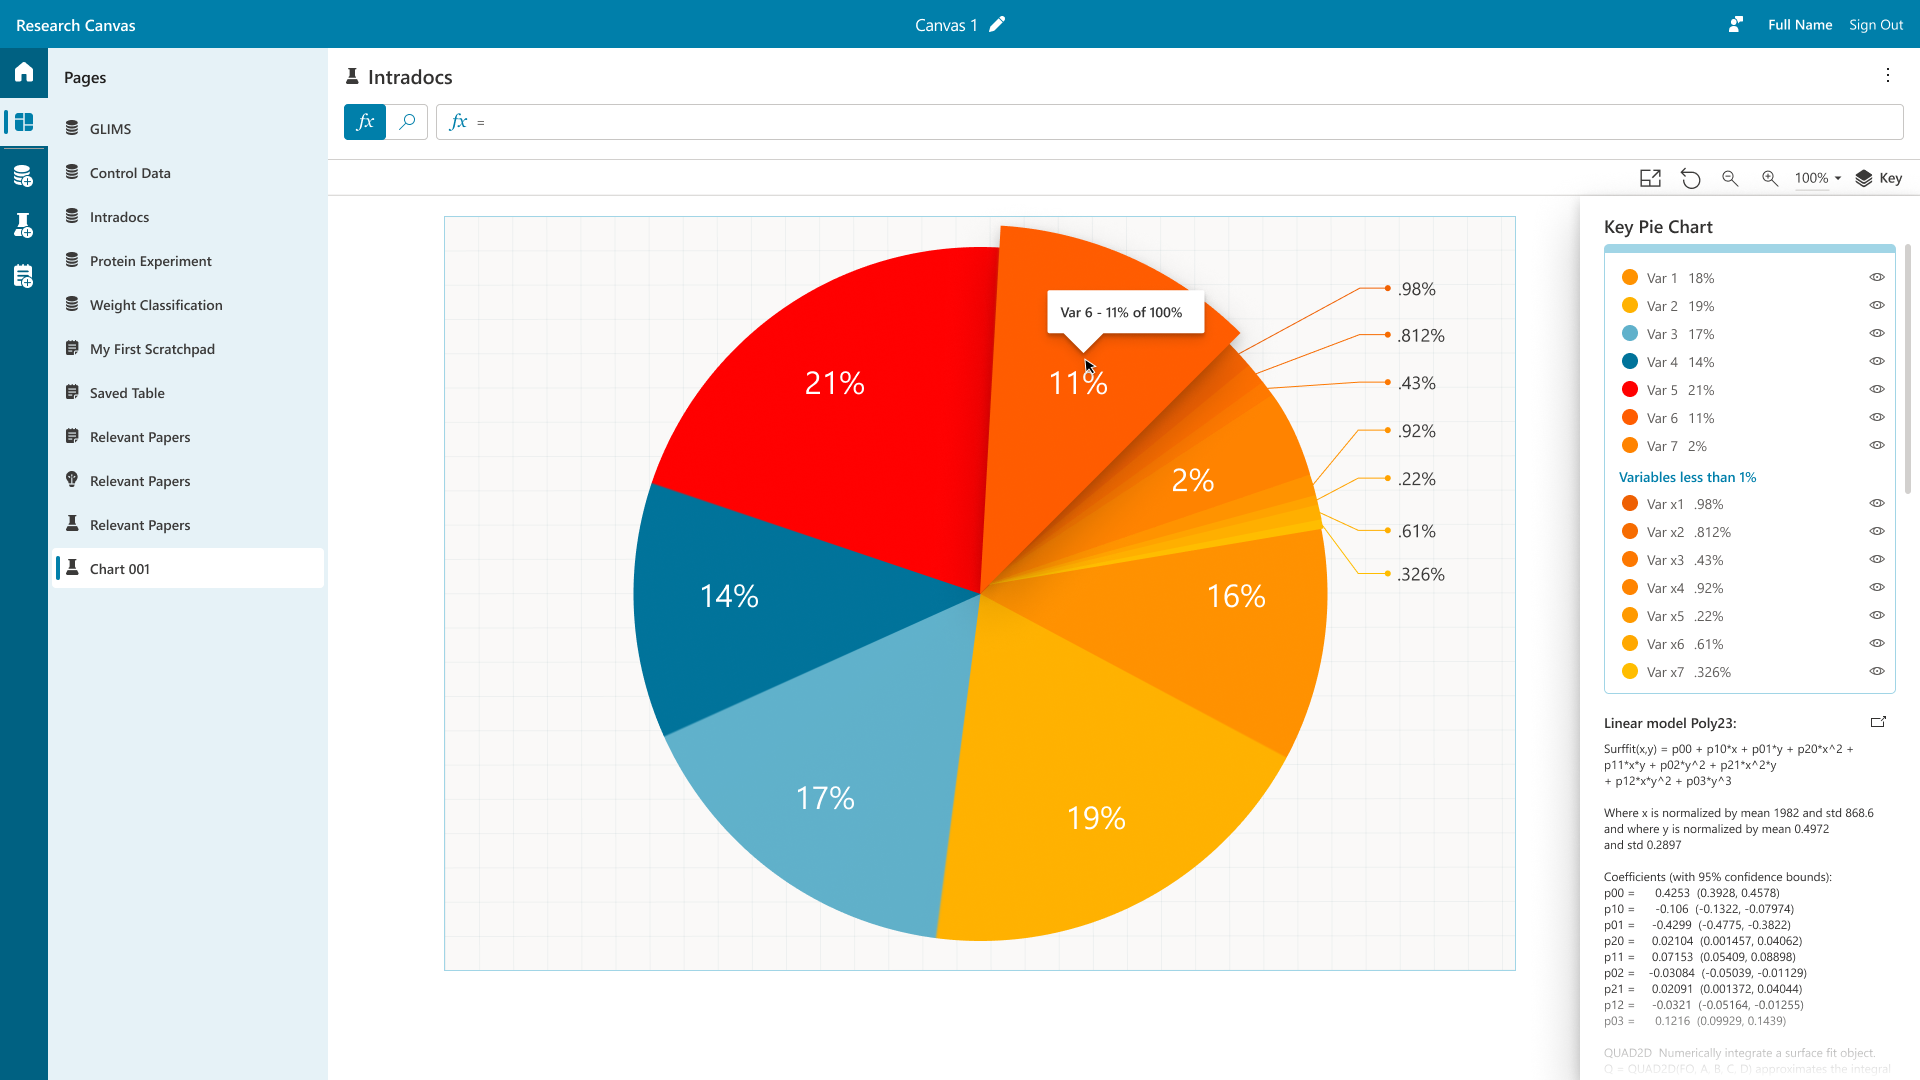
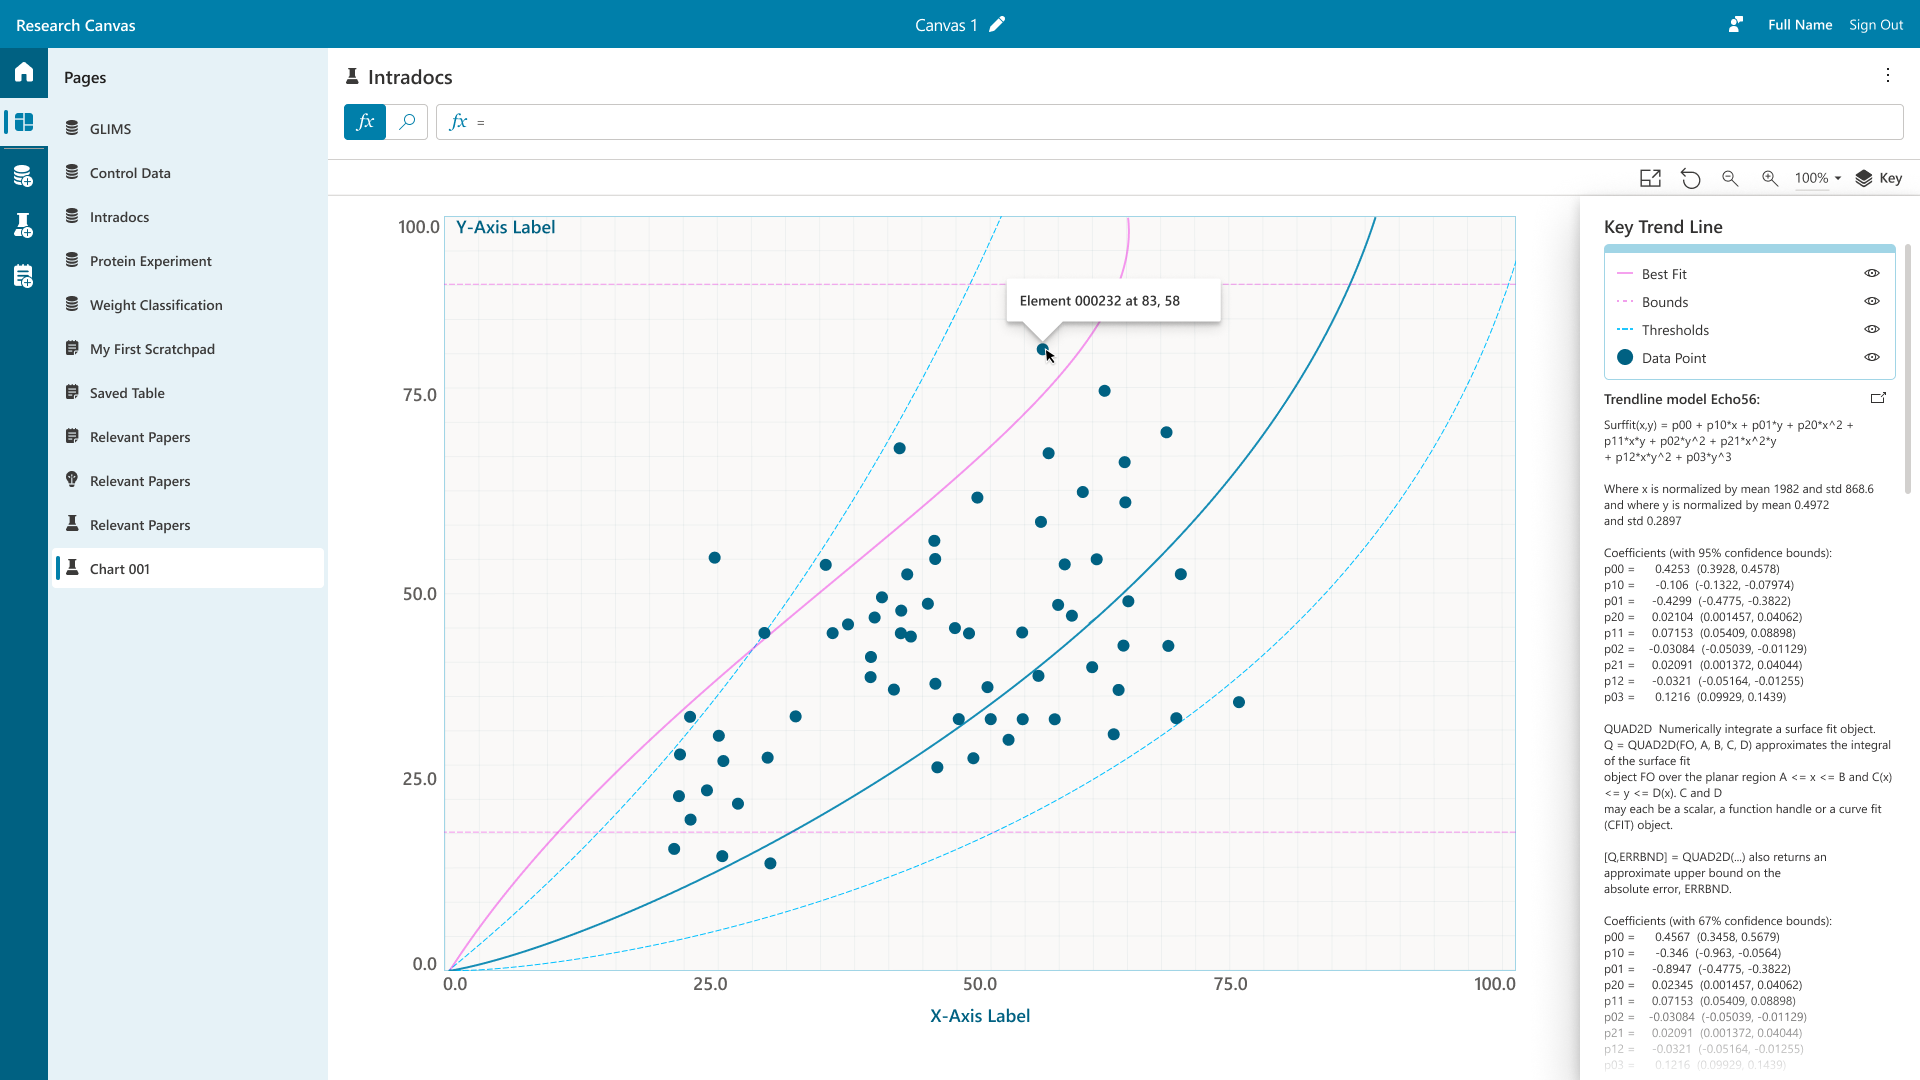
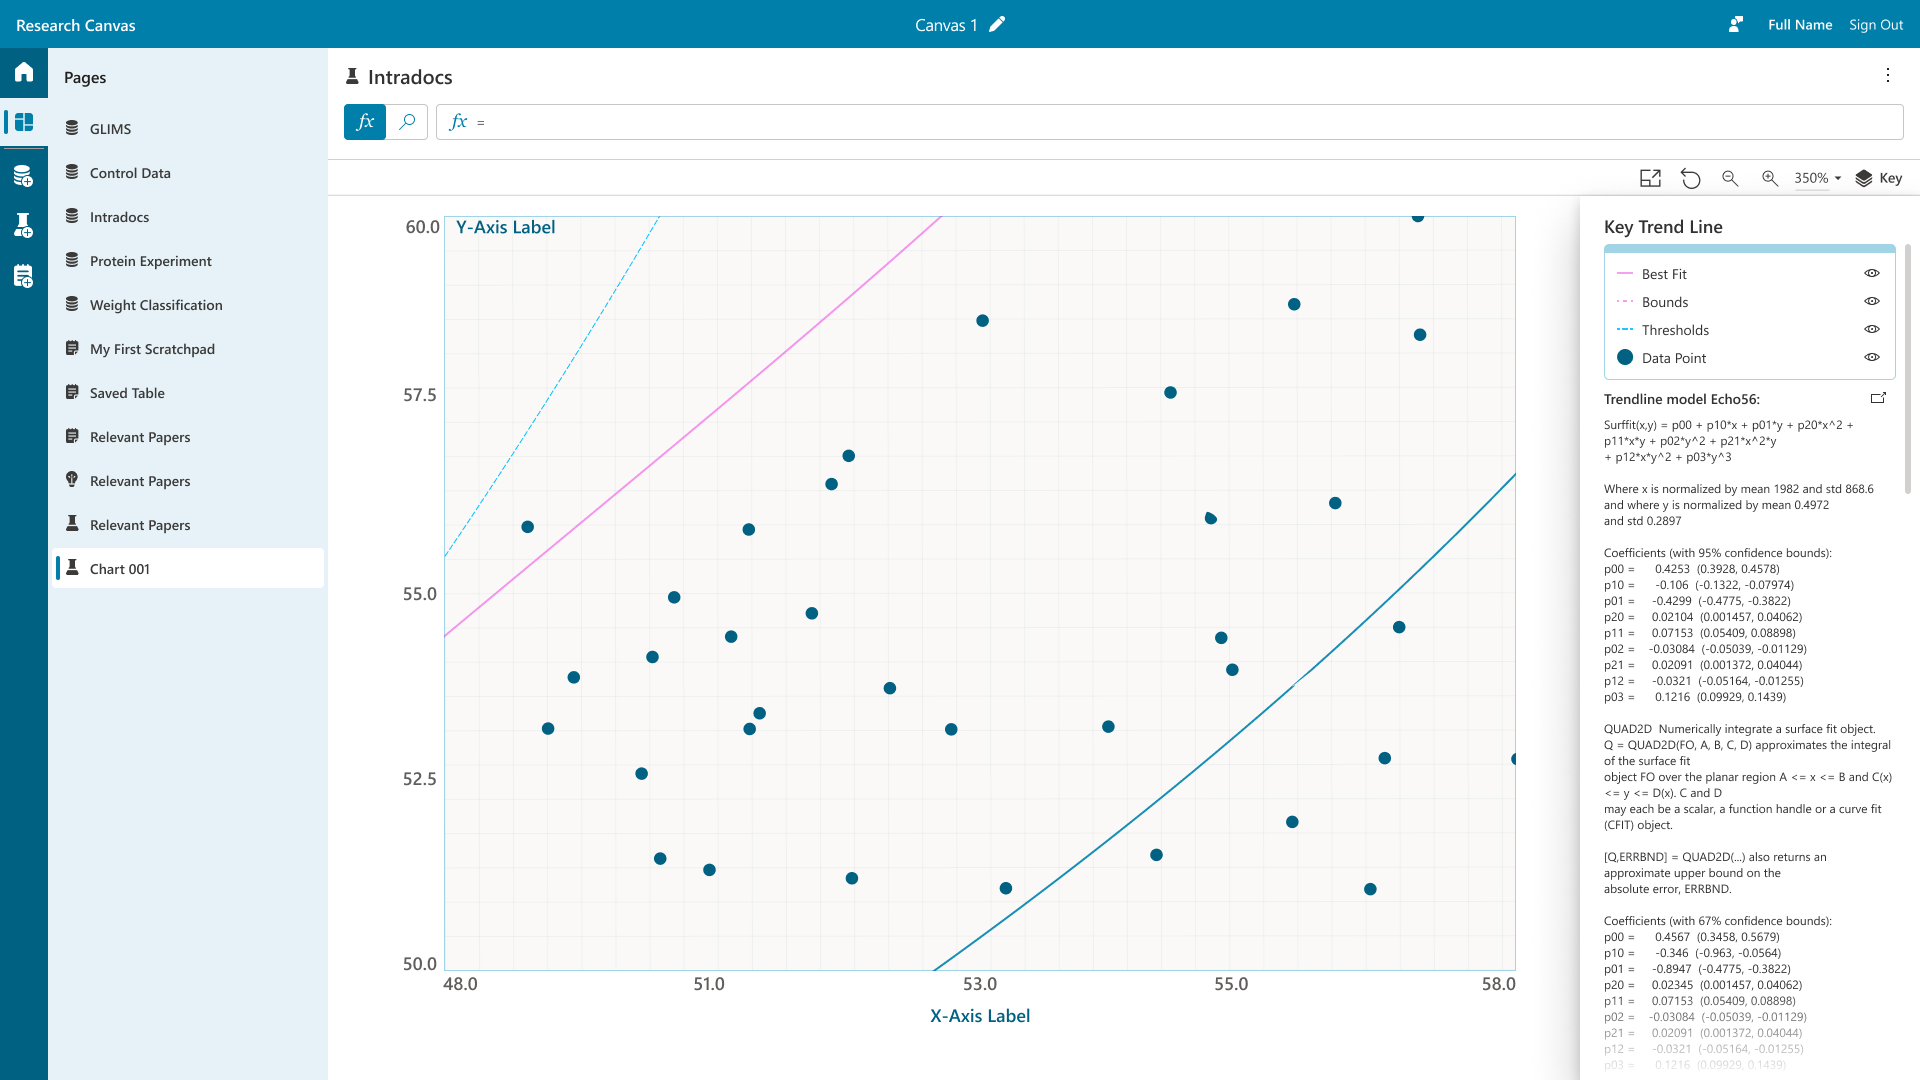
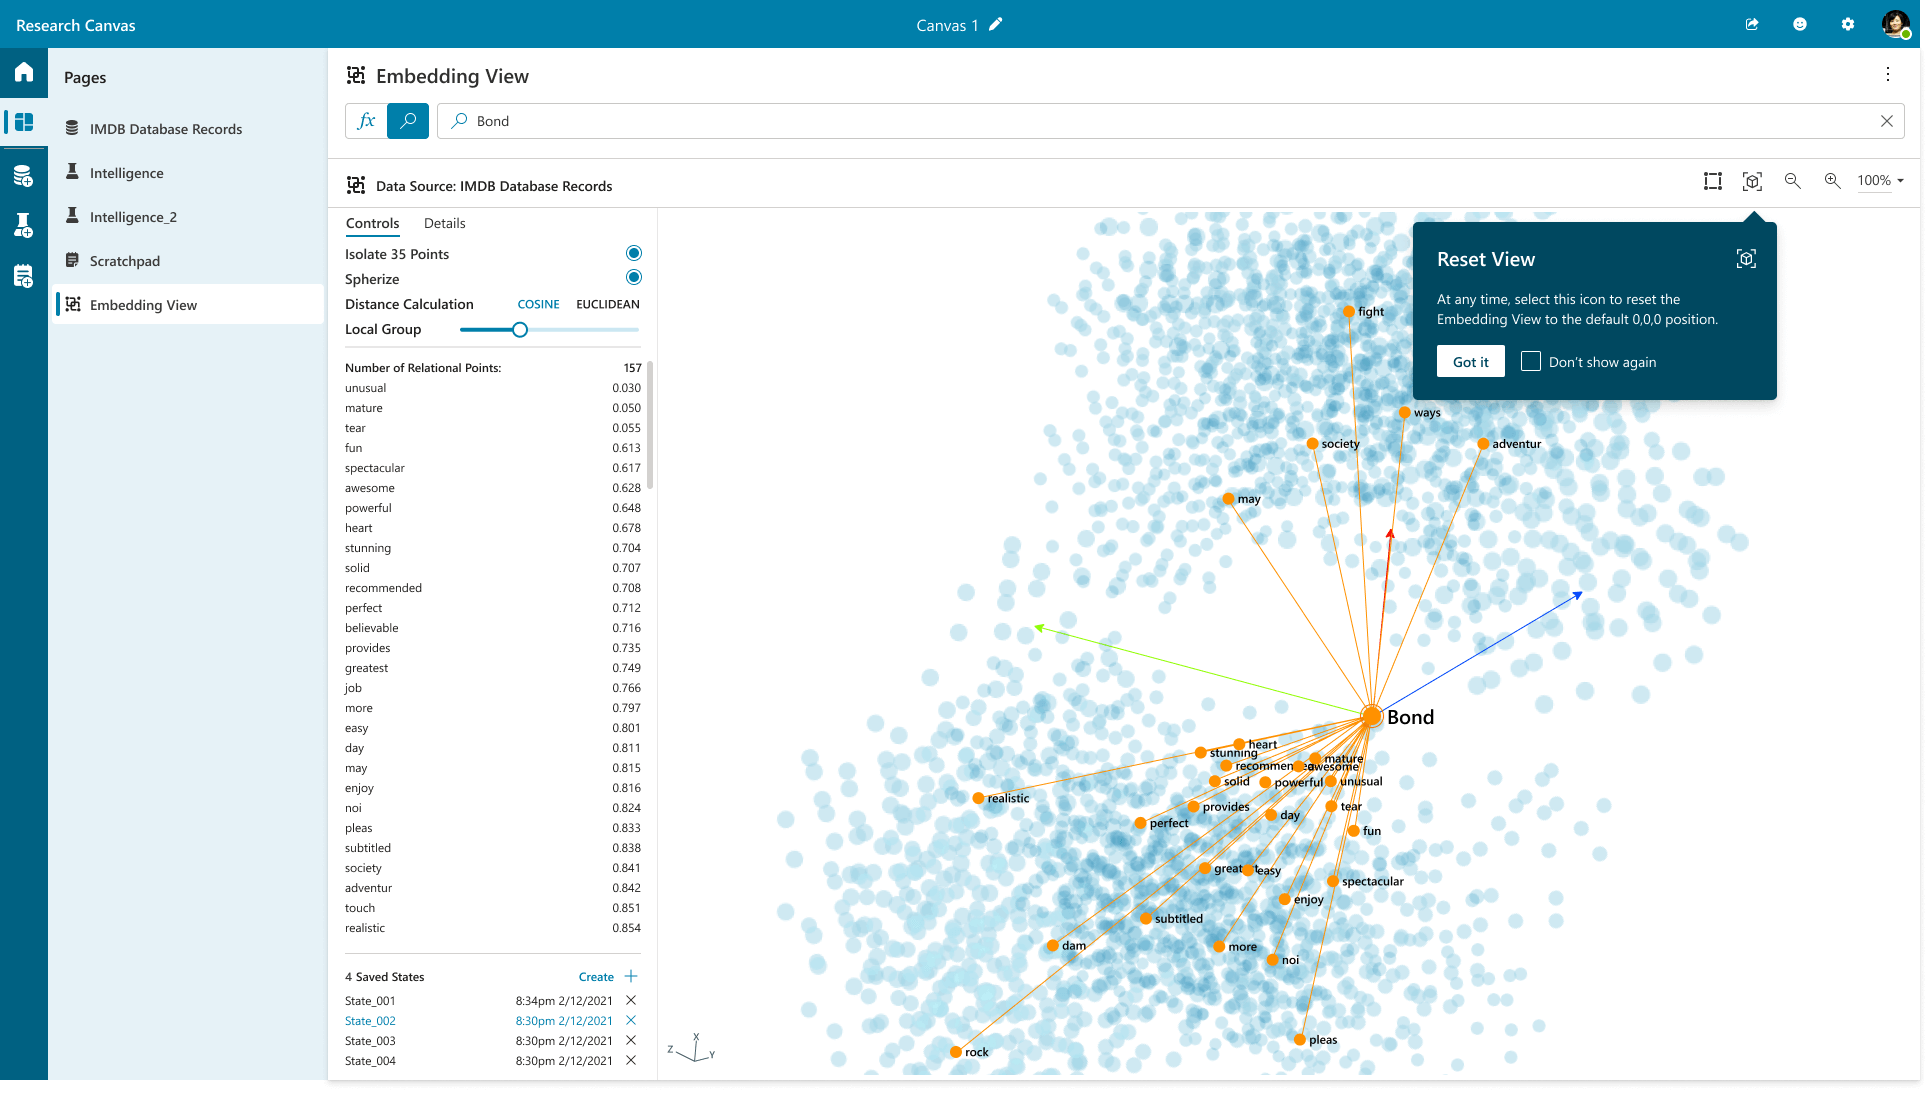
Visualizations
Visualizations play a crucial role in transforming raw data into meaningful insights by enhancing comprehension, fostering exploration, and simplifying complex relationships. By representing data visually—through charts, graphs, maps, and other graphical formats—users can quickly identify trends, patterns, and anomalies that might be obscured in raw numerical formats. For example, a line graph can illustrate changes over time, making it easier to spot correlations and growth trends, while scatter plots can reveal the relationship between two variables at a glance. Additionally, visualizations facilitate data storytelling, allowing users to communicate findings effectively to stakeholders who may not have technical expertise. Ultimately, by simplifying the interpretation of large datasets, visualizations empower decision-makers to draw actionable conclusions, thereby enhancing data-driven decisions and strategies.
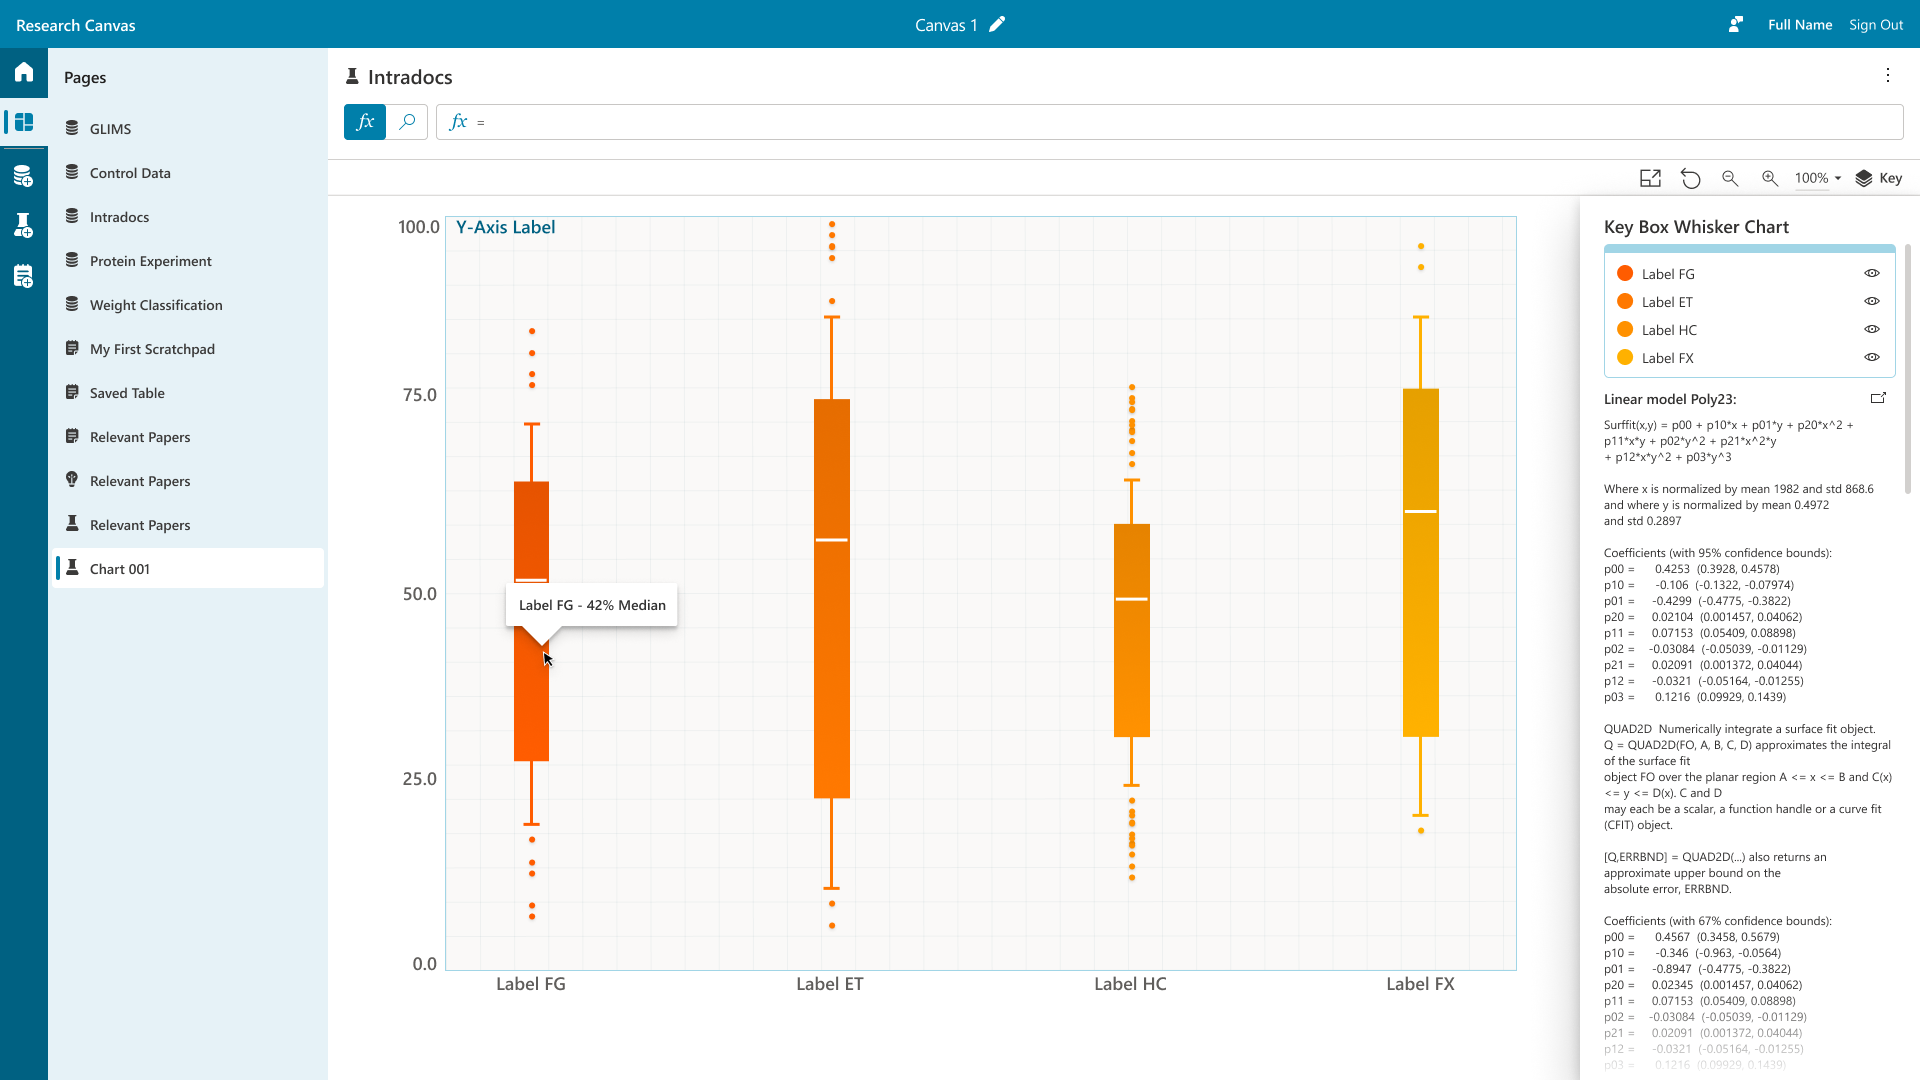

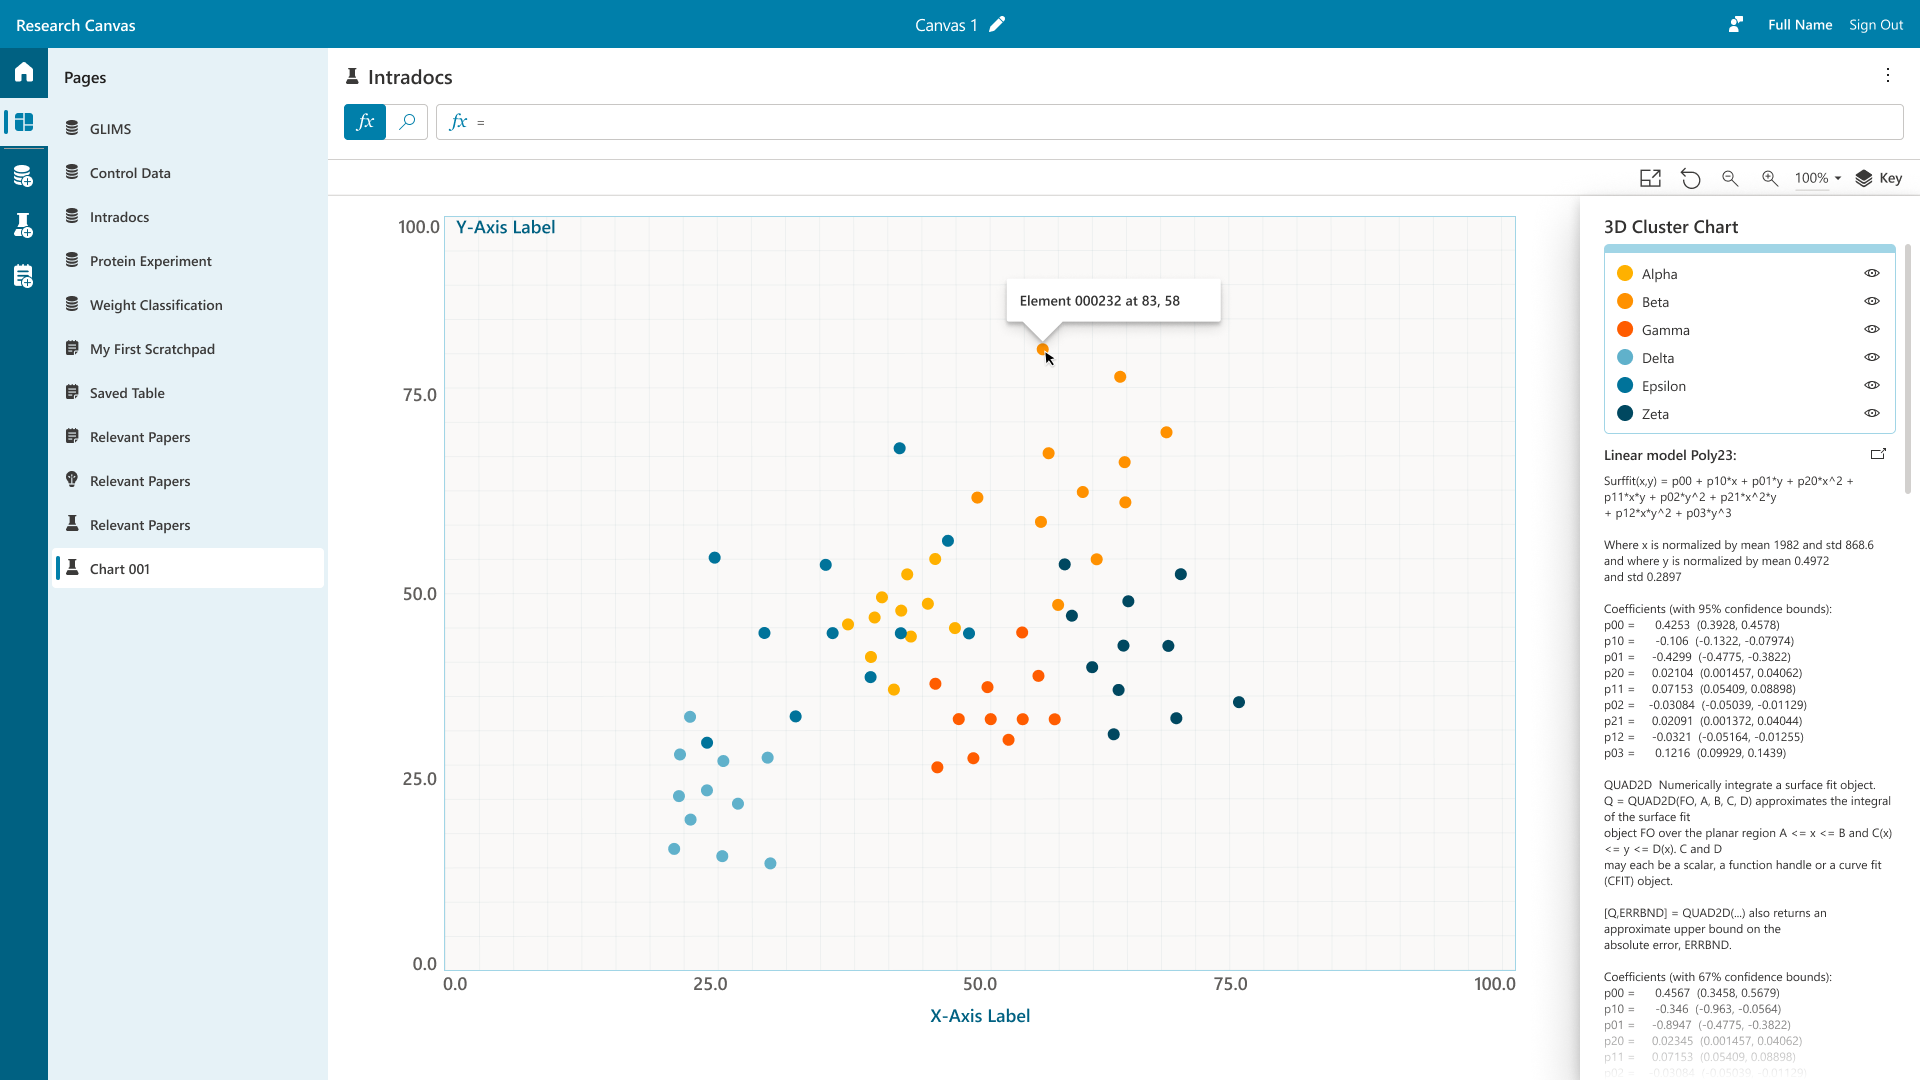


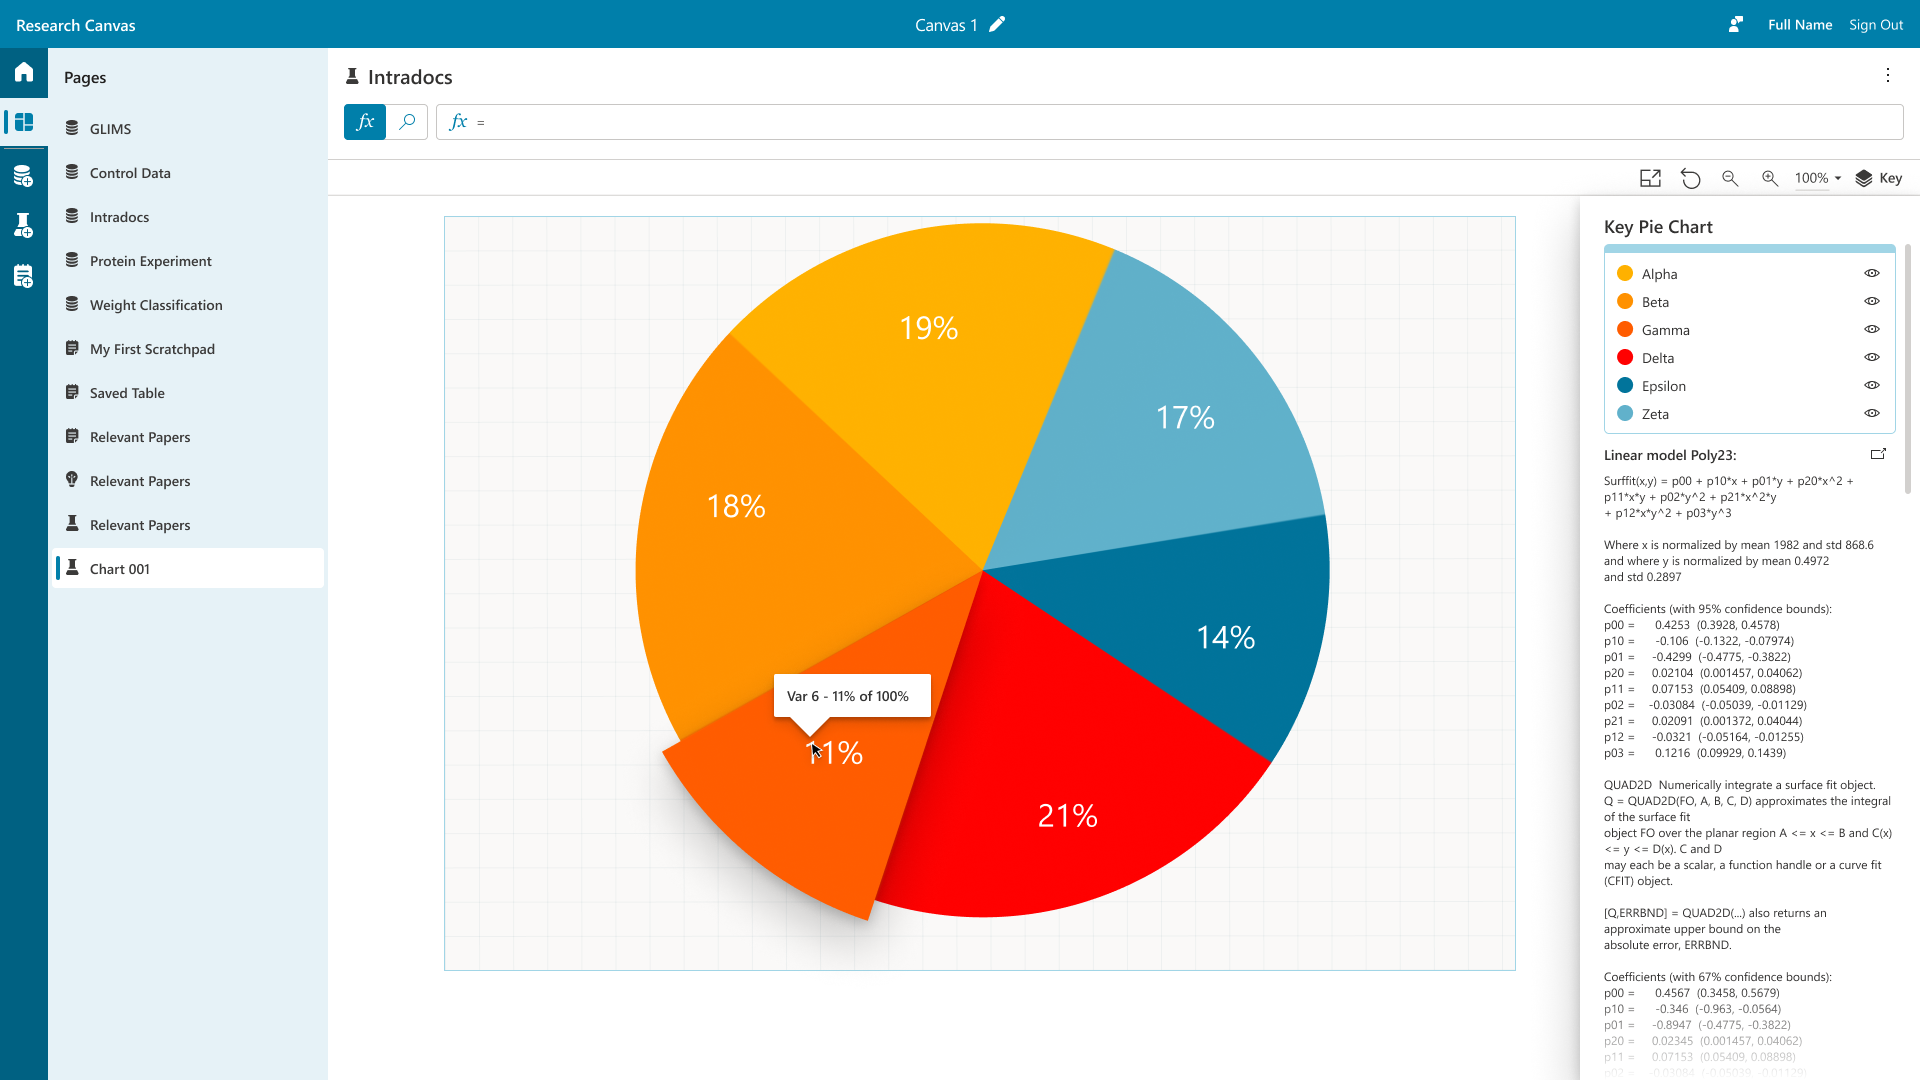
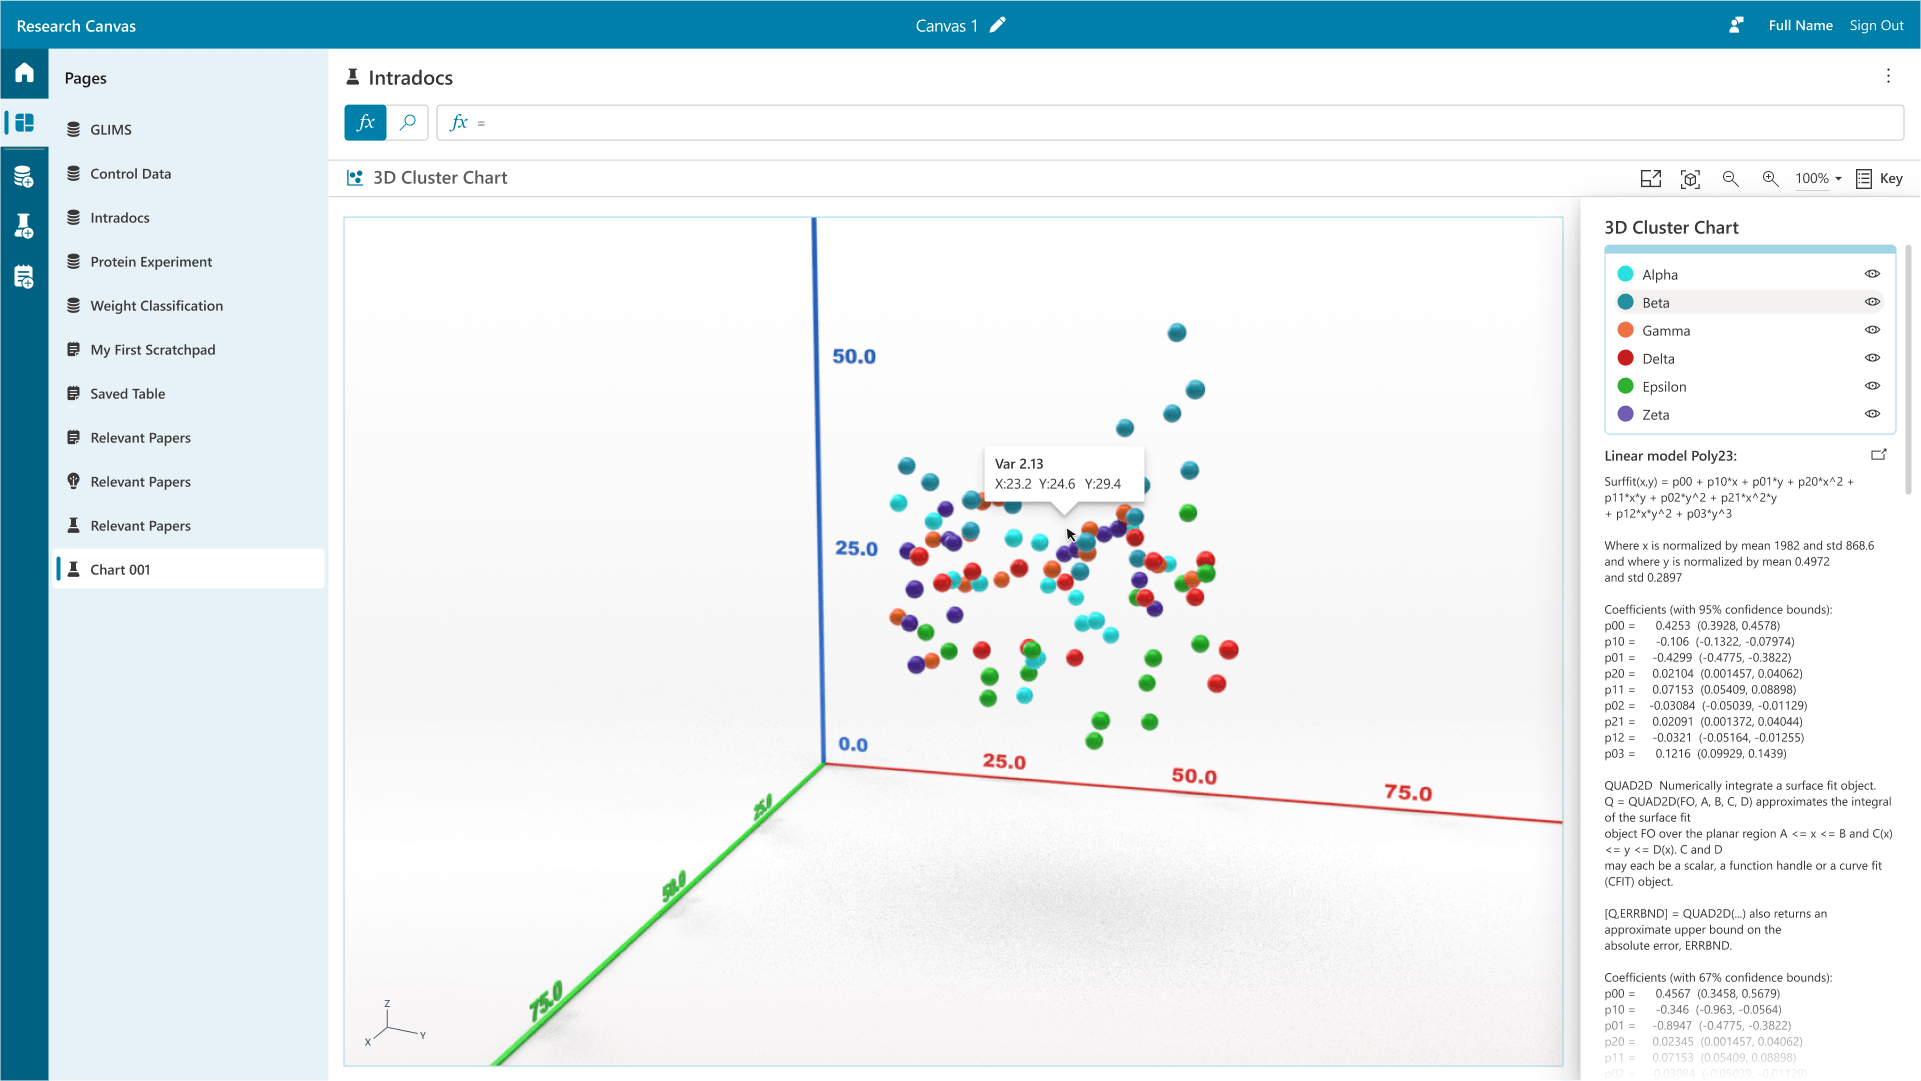
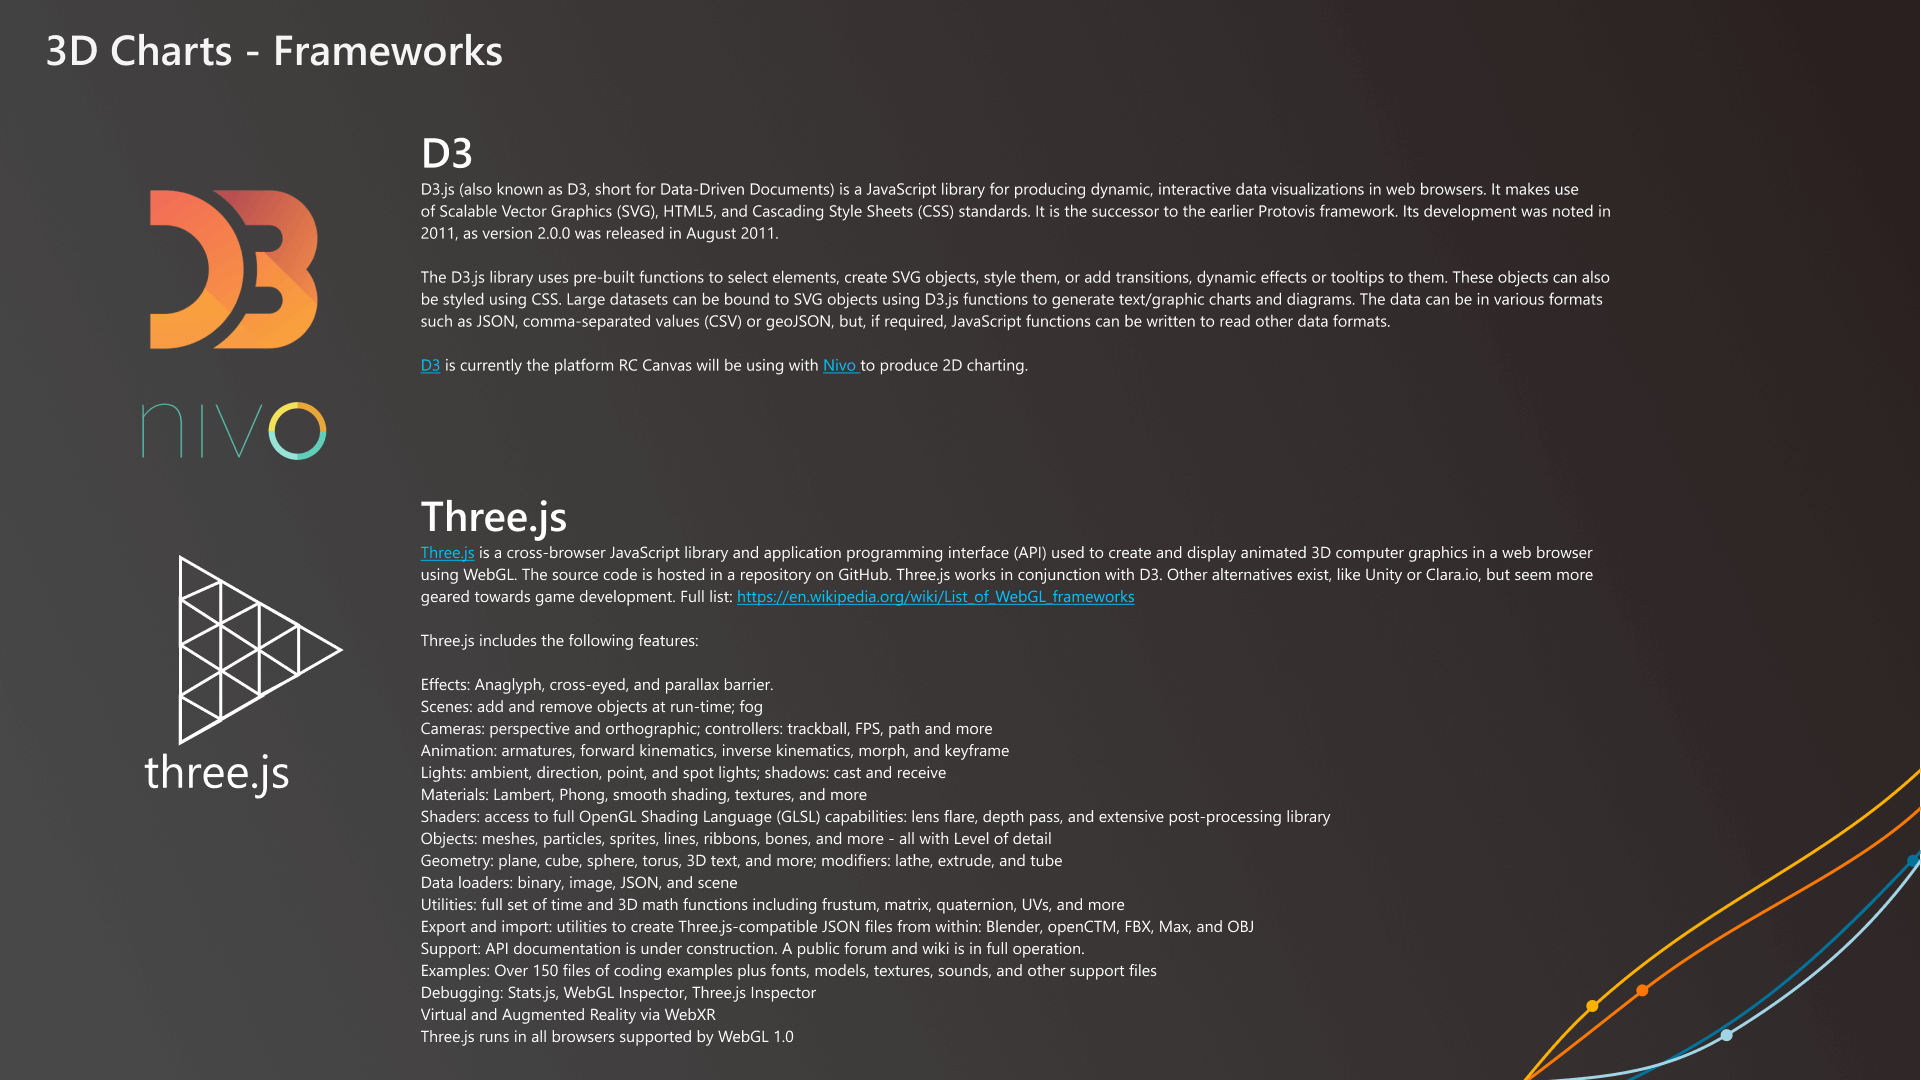
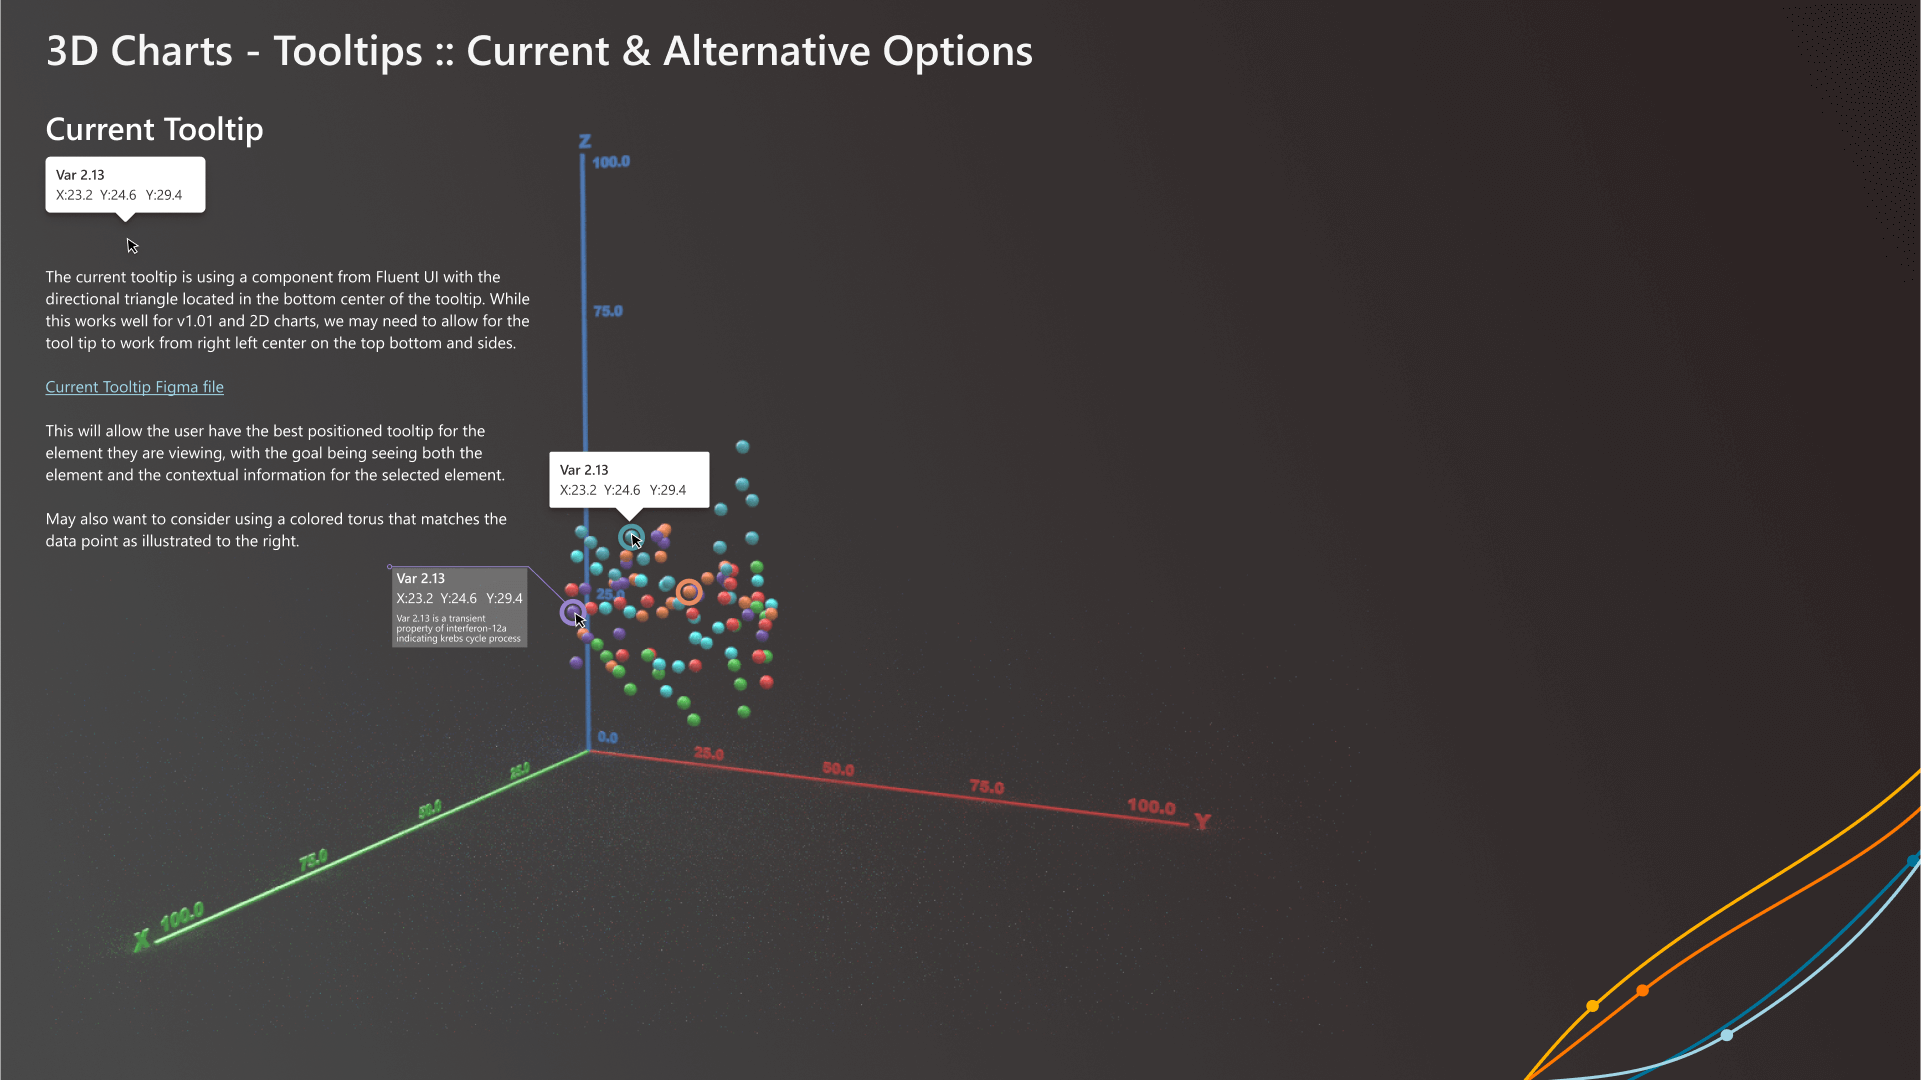
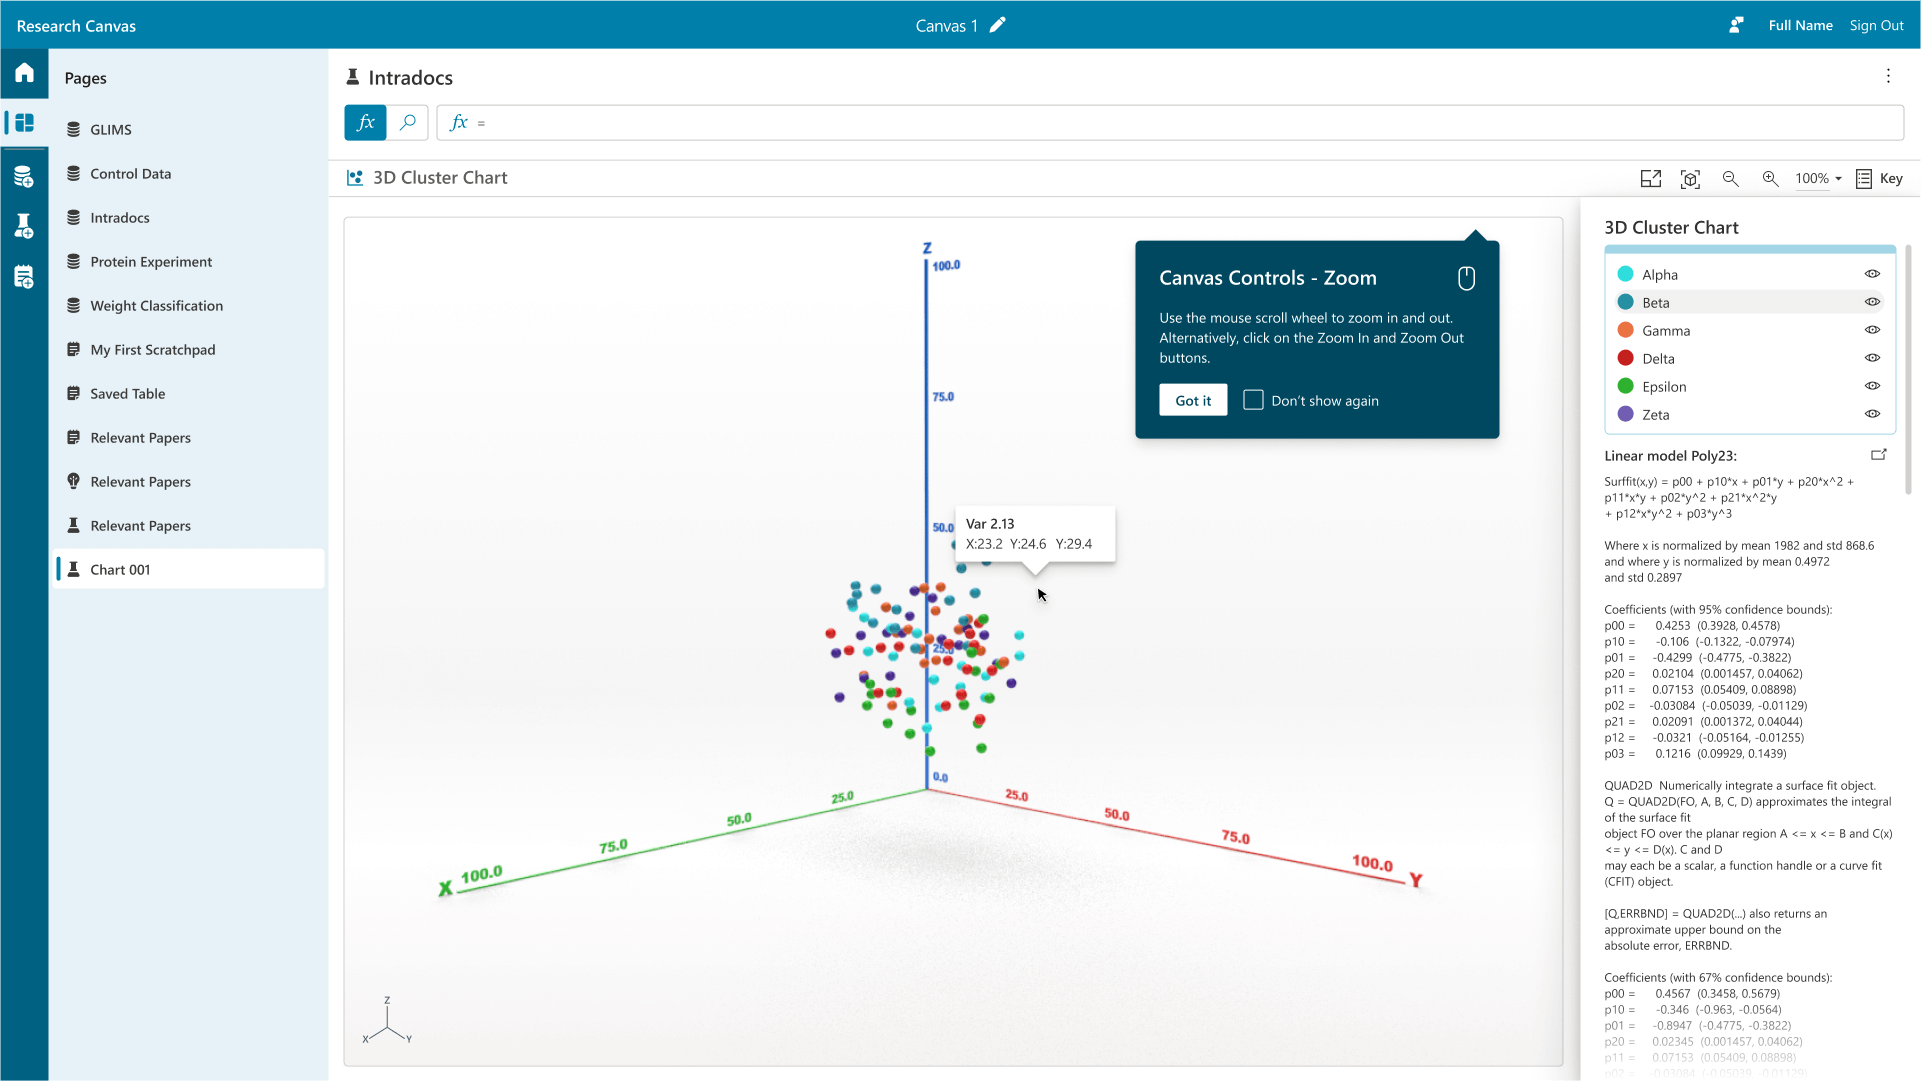
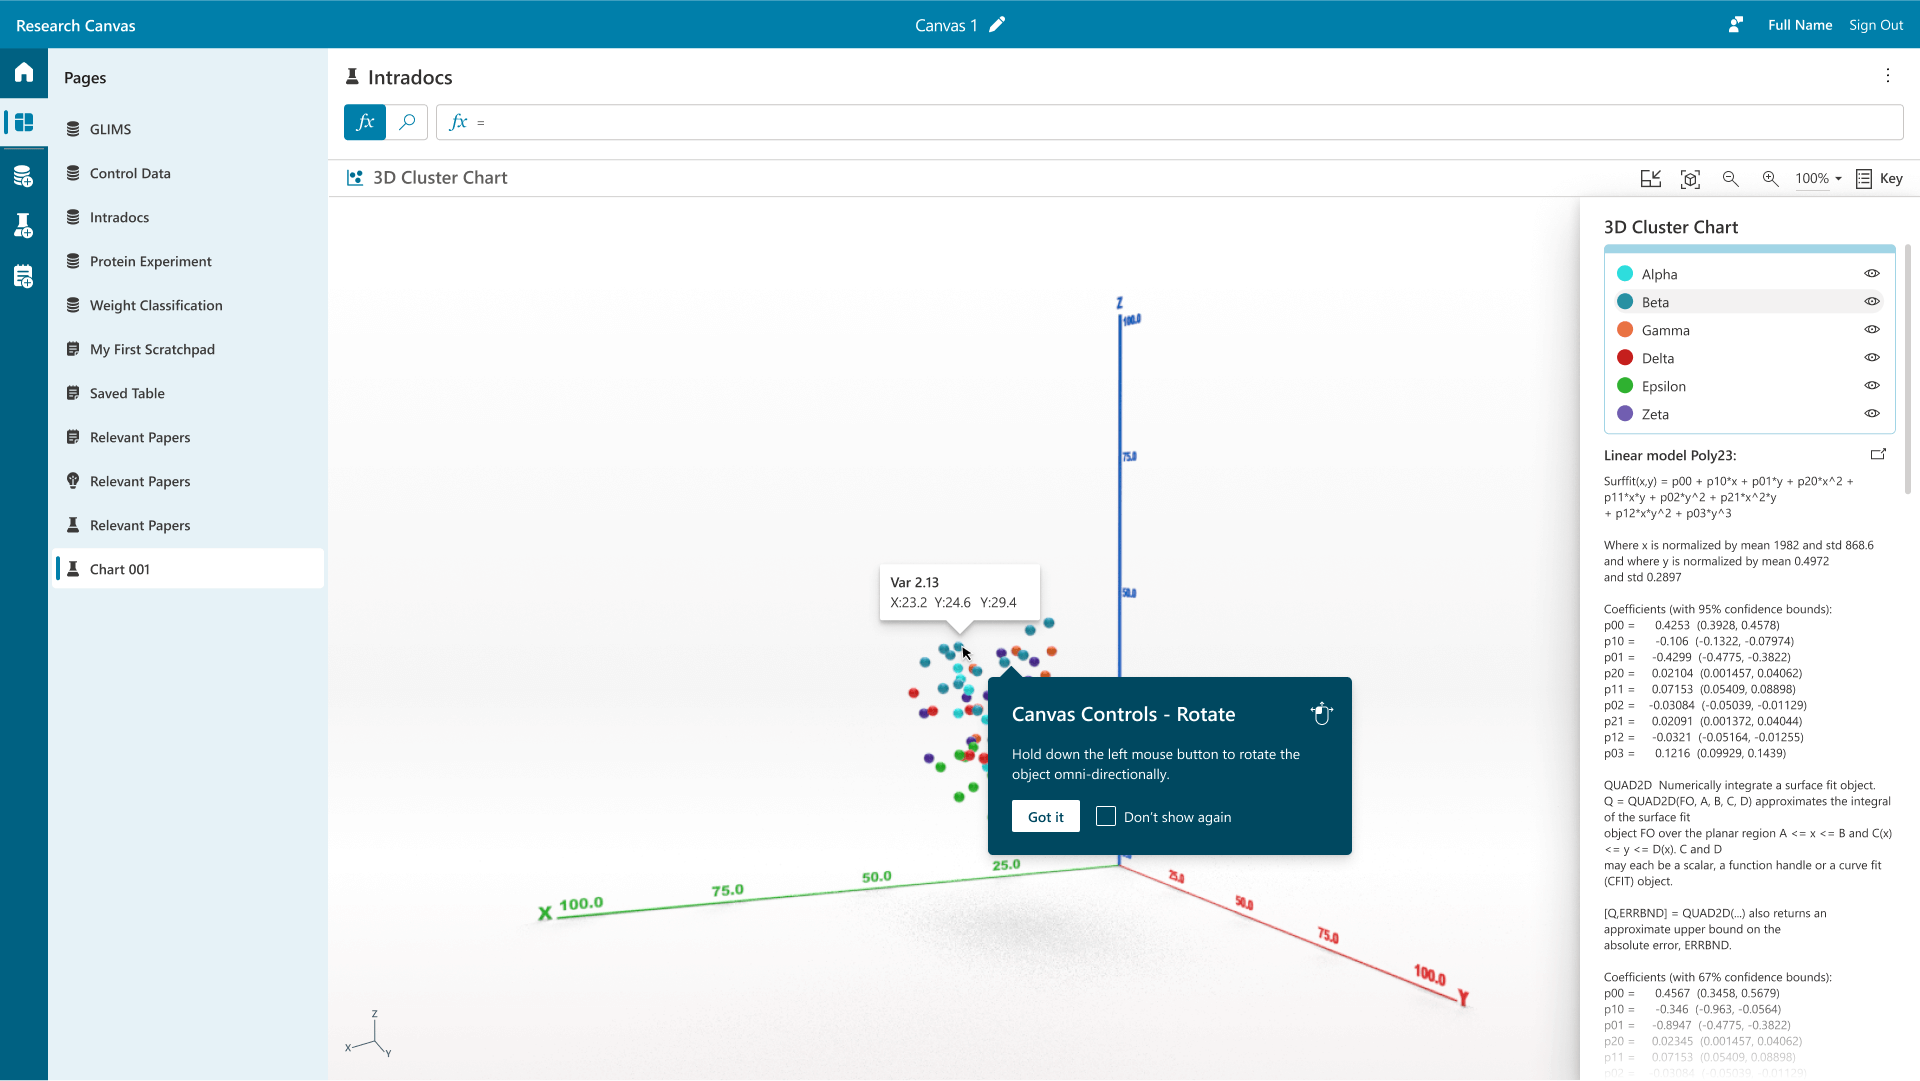
3d Charts
The need for visualizations in 3d space arises from the complexity of the data that many modern fields must analyze, such as scientific research, engineering, healthcare, and data science. 3d visualizations enable users to represent and explore multidimensional datasets more effectively, allowing for the visualization of relationships and interactions among multiple variables that cannot be captured in 2D representations. For example, in medical imaging, 3d models can provide a comprehensive view of anatomical structures, facilitating diagnosis and surgical planning. In scientific research, 3d visualizations can illustrate the spatial distribution of phenomena, such as climate patterns or molecular structures, enhancing understanding and discovery. Additionally, 3d environments can immerse users in interactive experiences, enabling real-time manipulation and exploration of data, which is particularly valuable for simulations and virtual reality applications. As data continues to grow in complexity, leveraging 3d visualizations becomes essential for comprehensively conveying insights and enhancing decision-making processes across various domains.


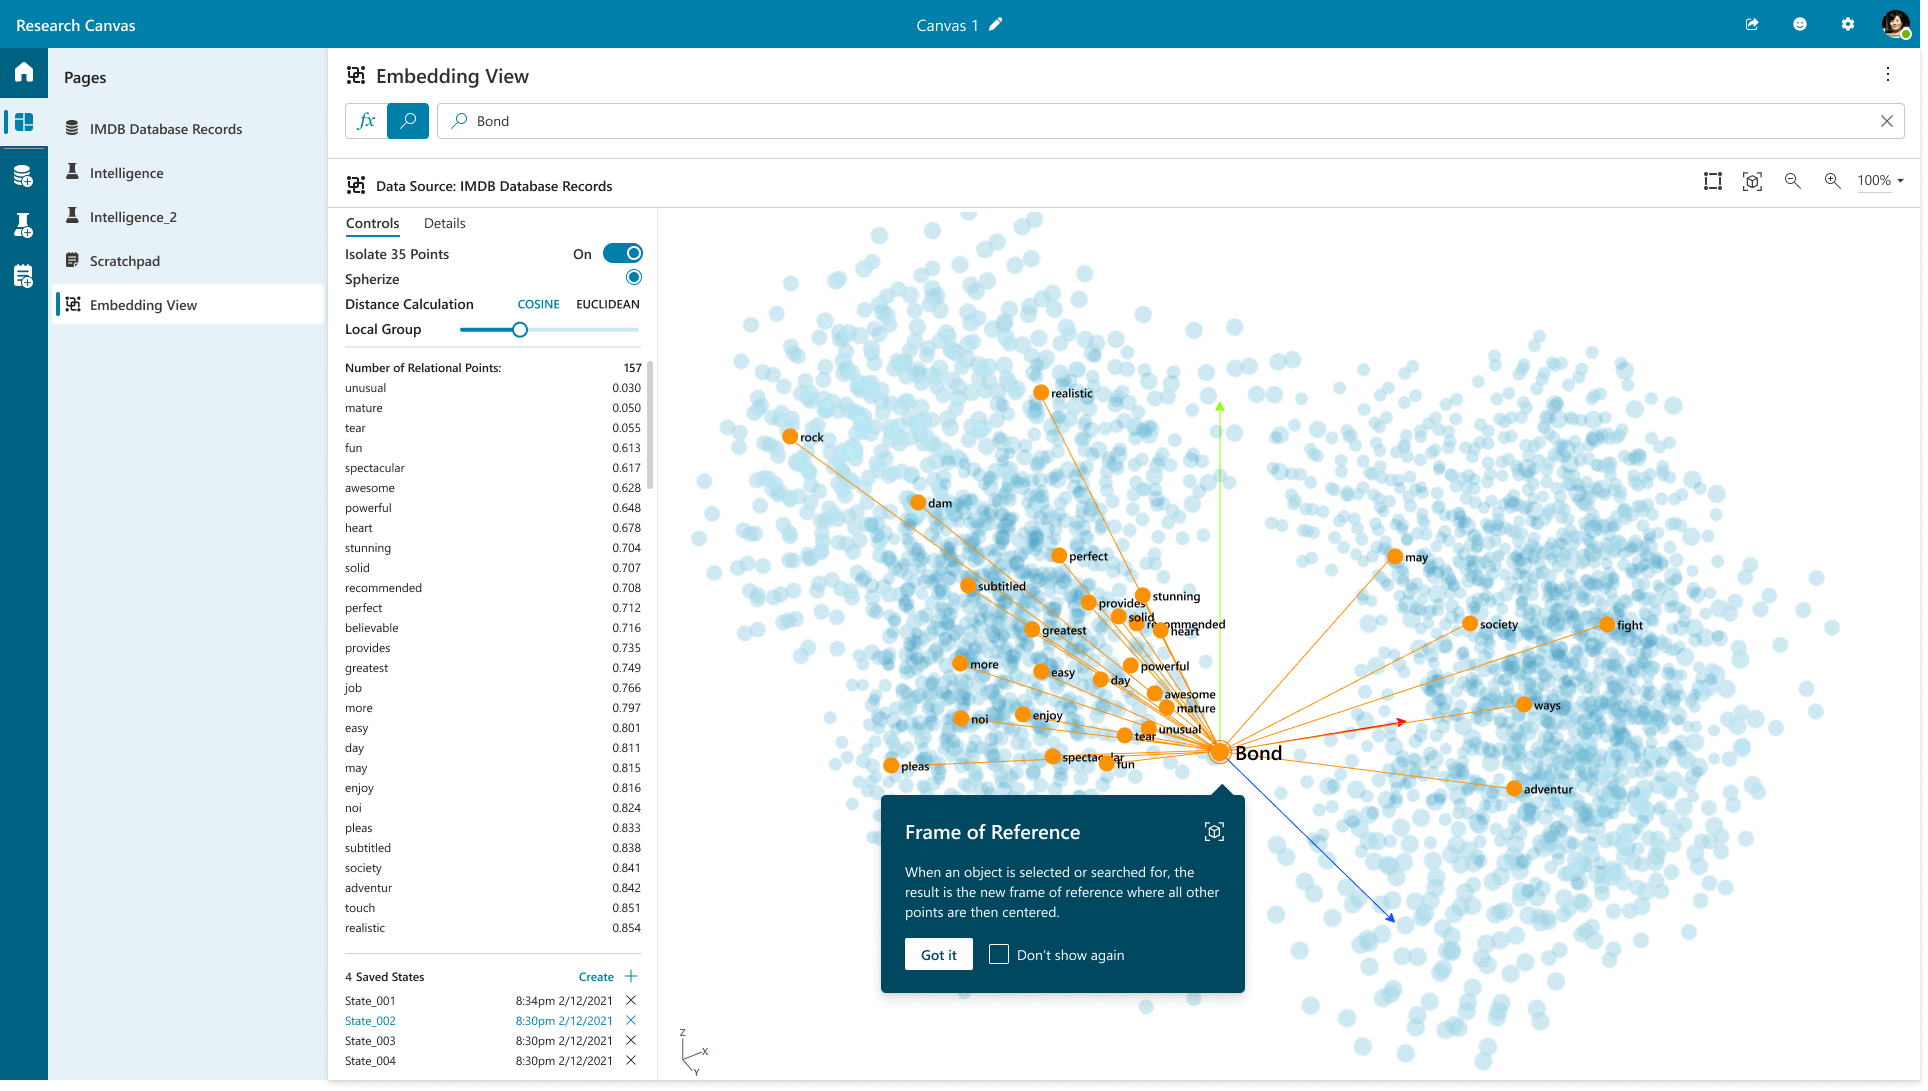
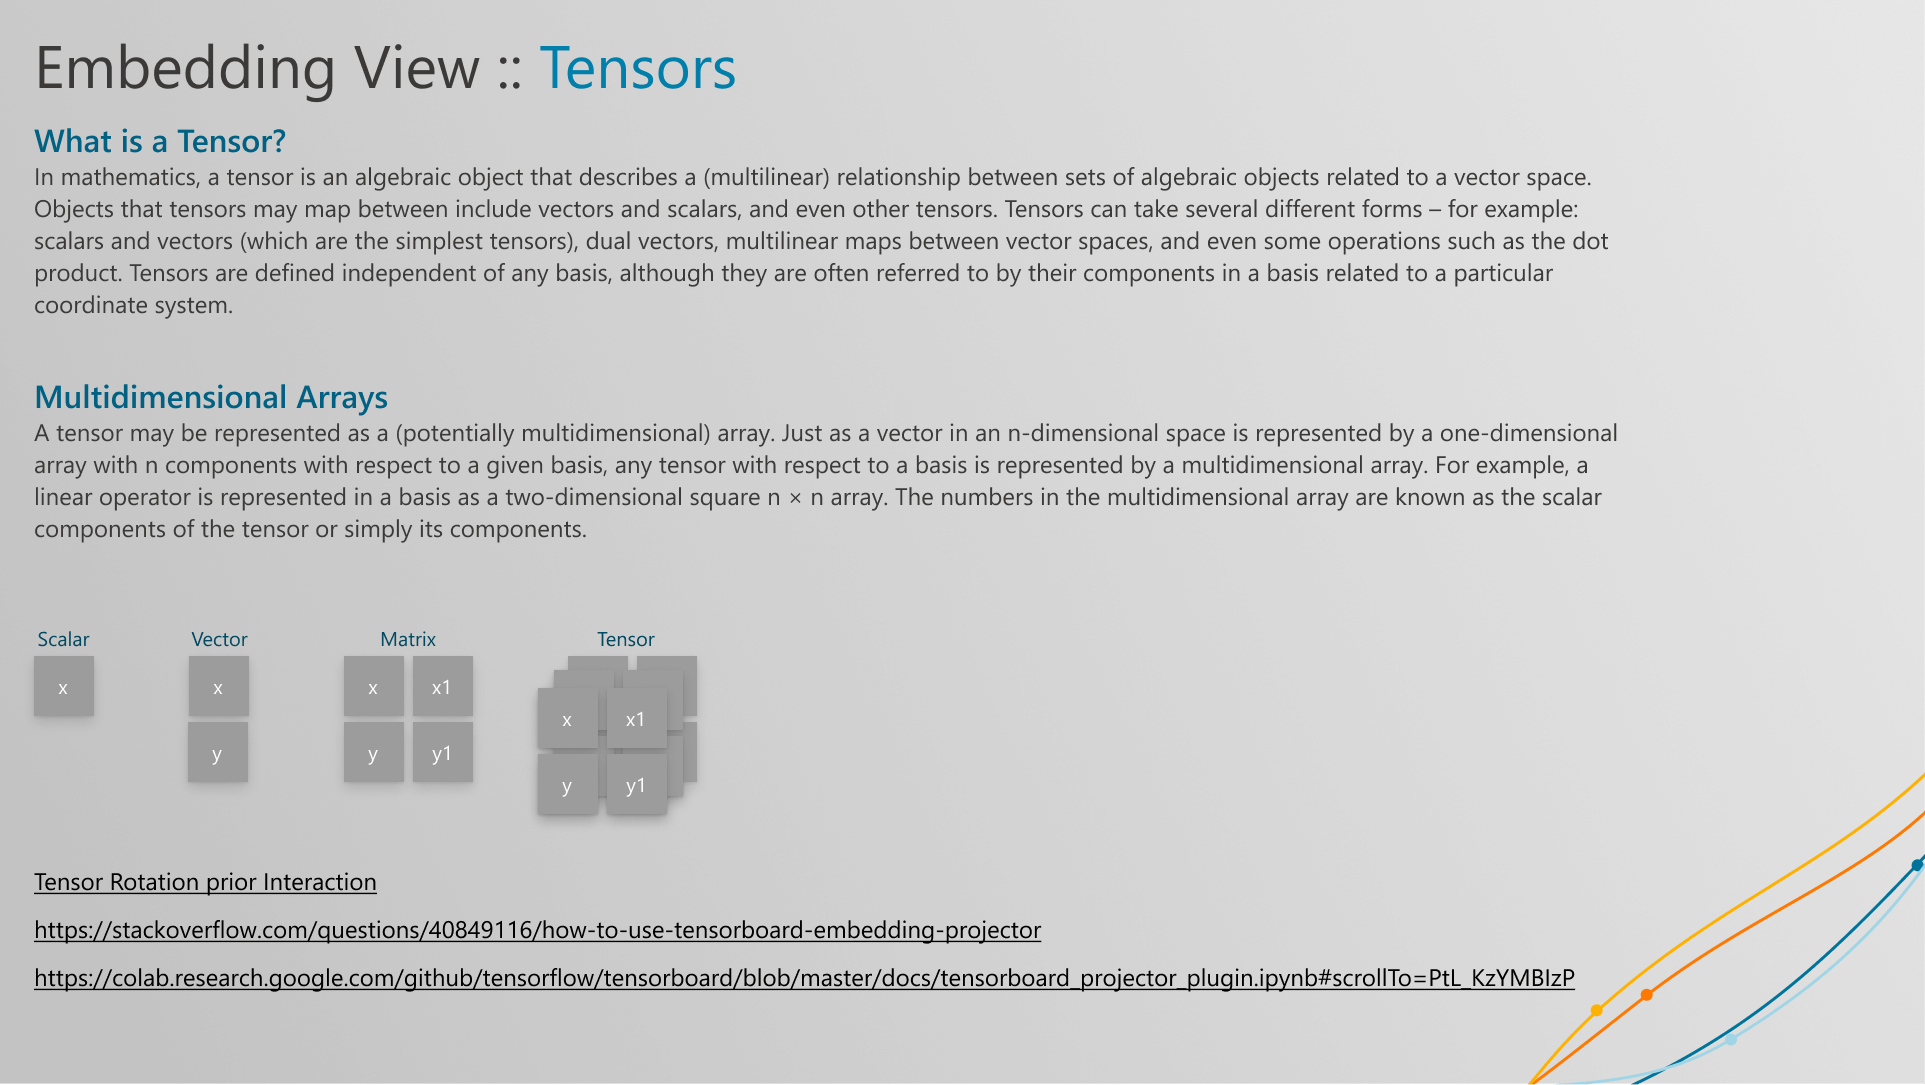
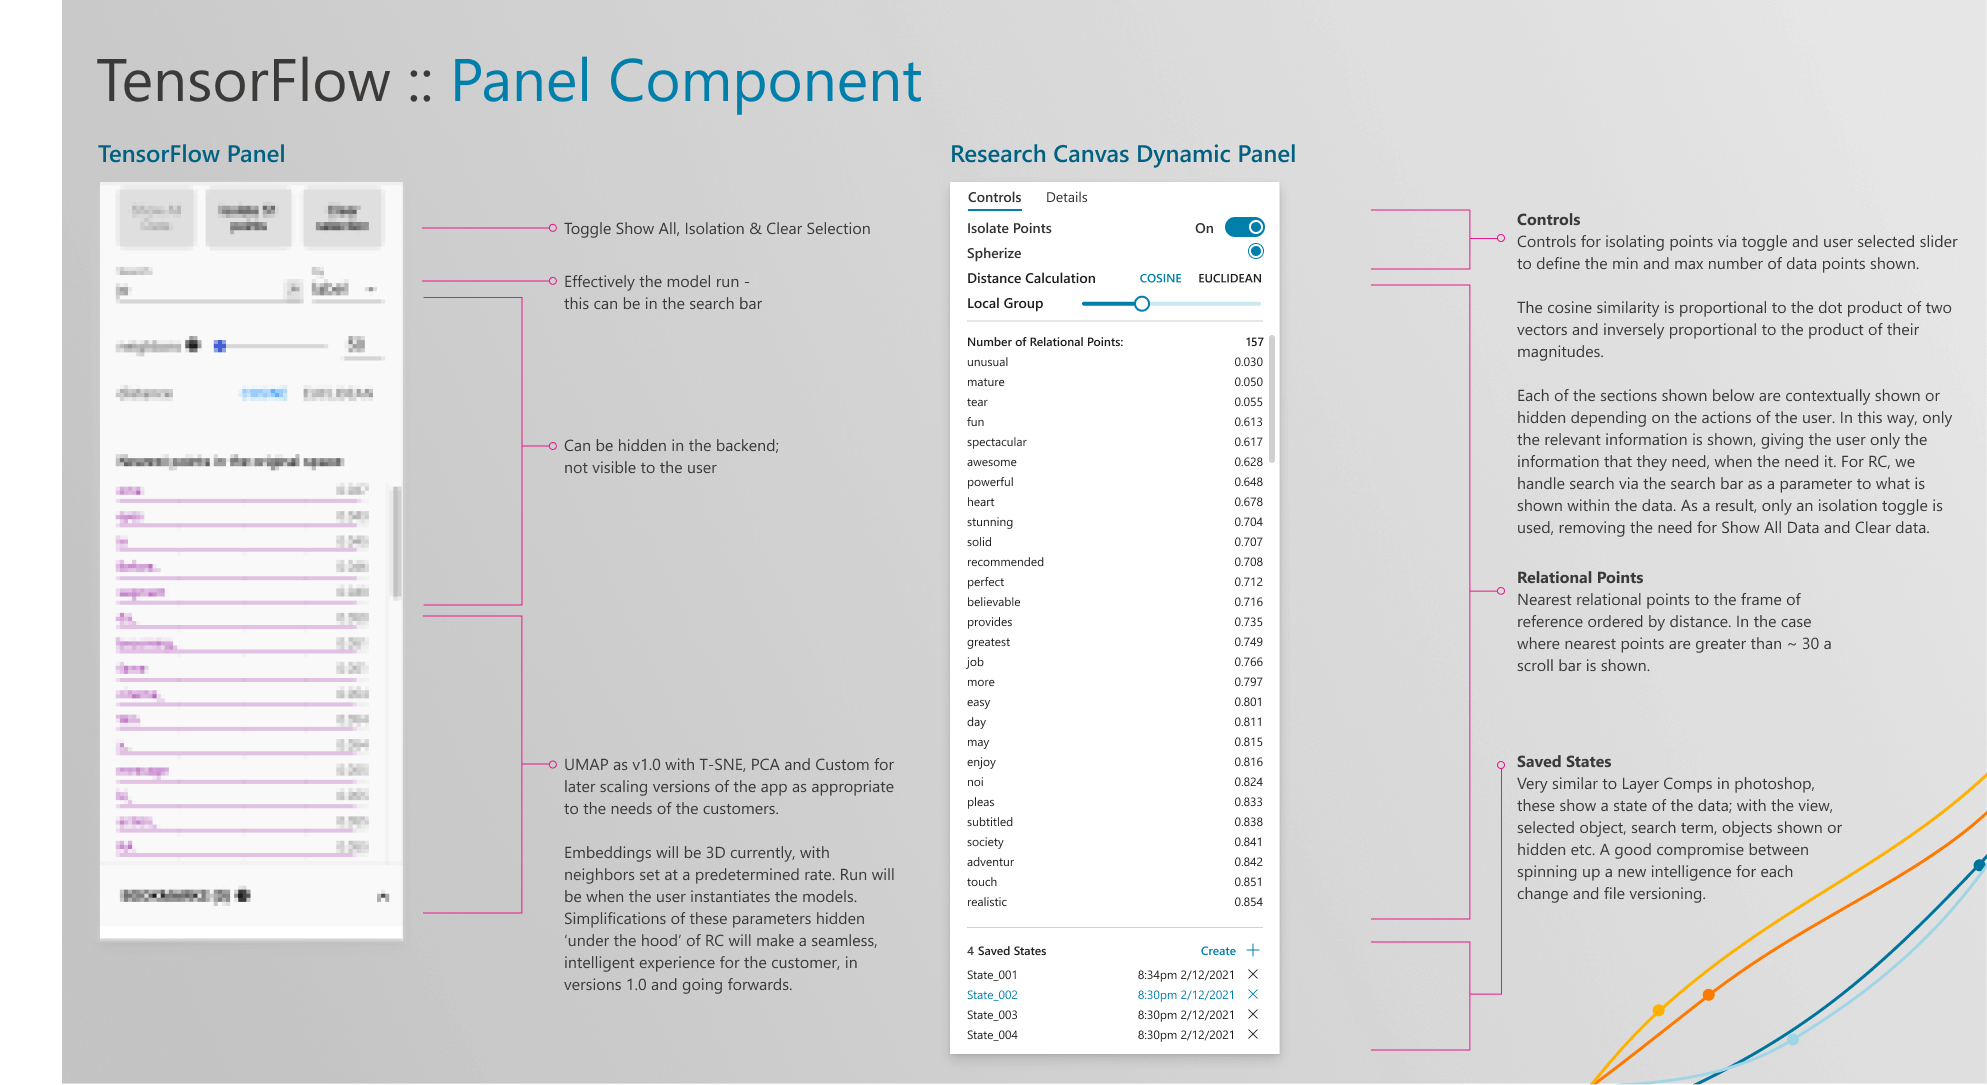
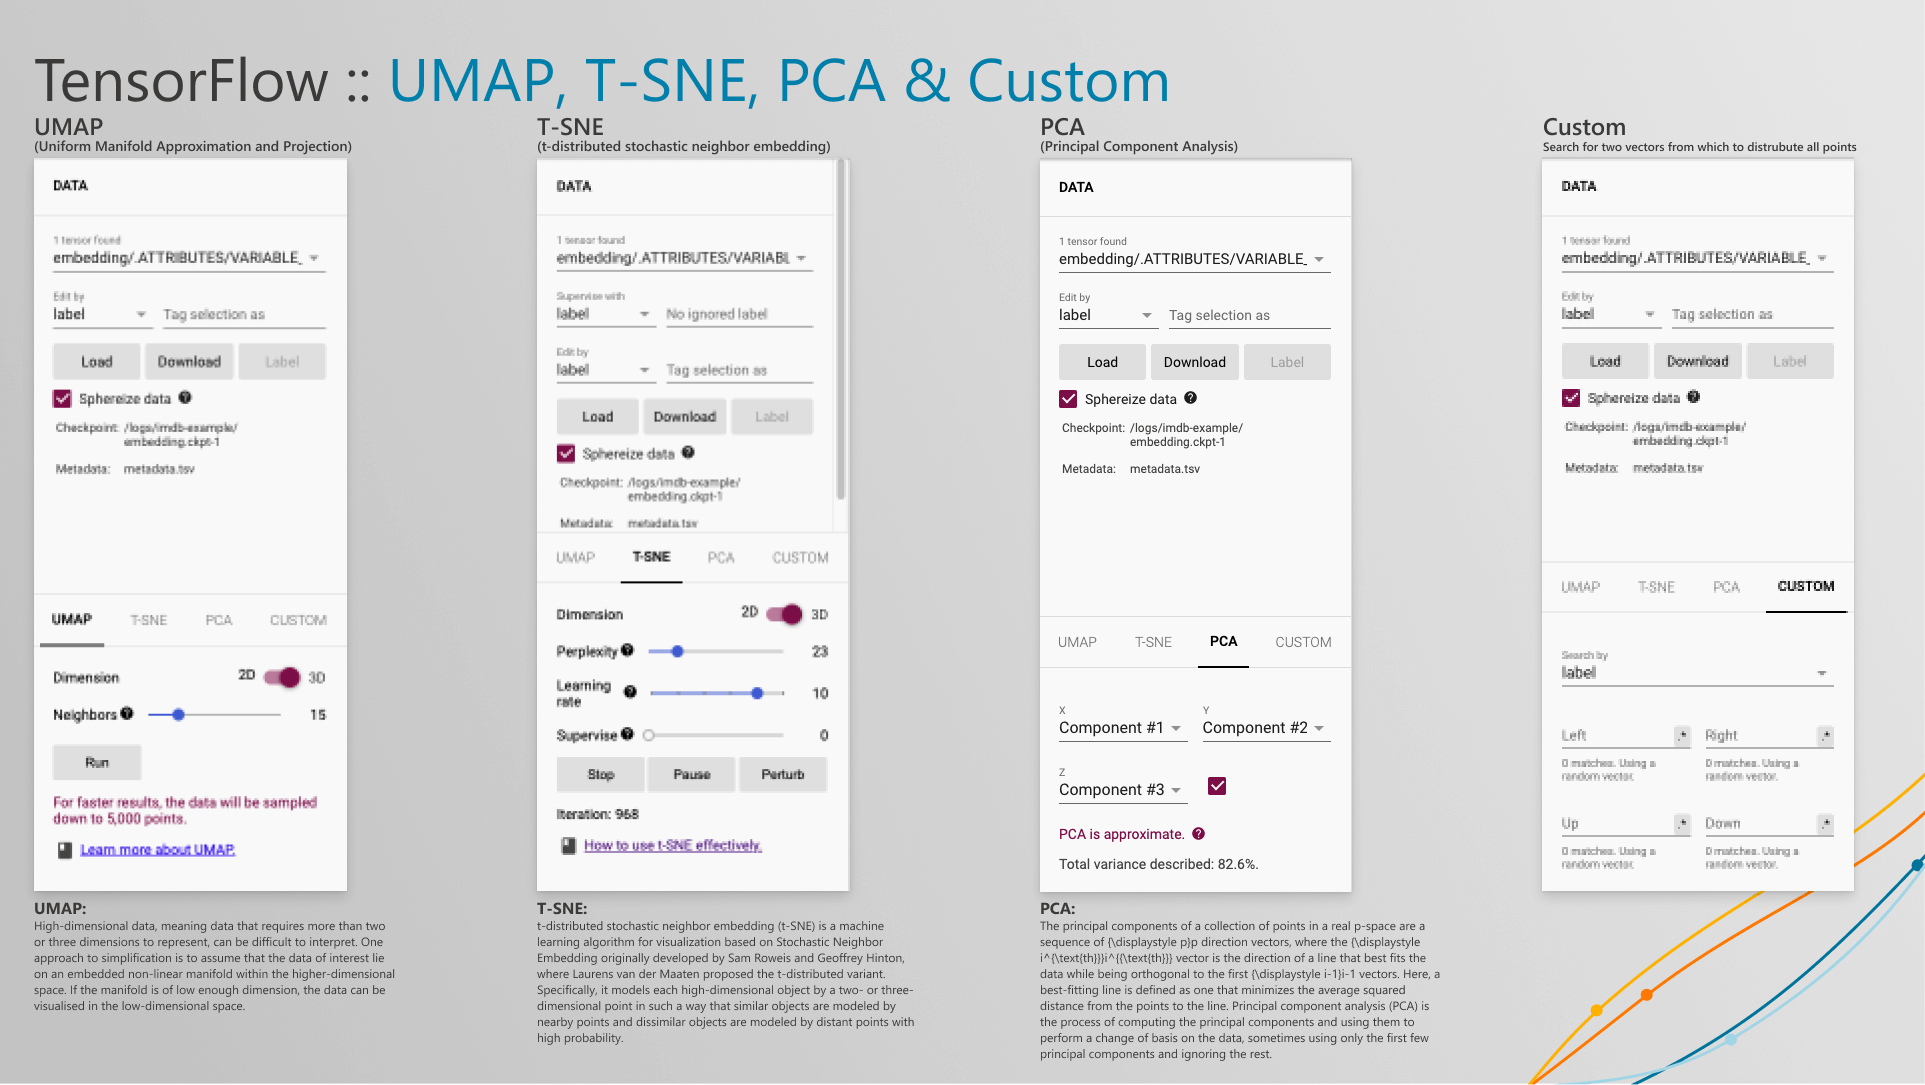
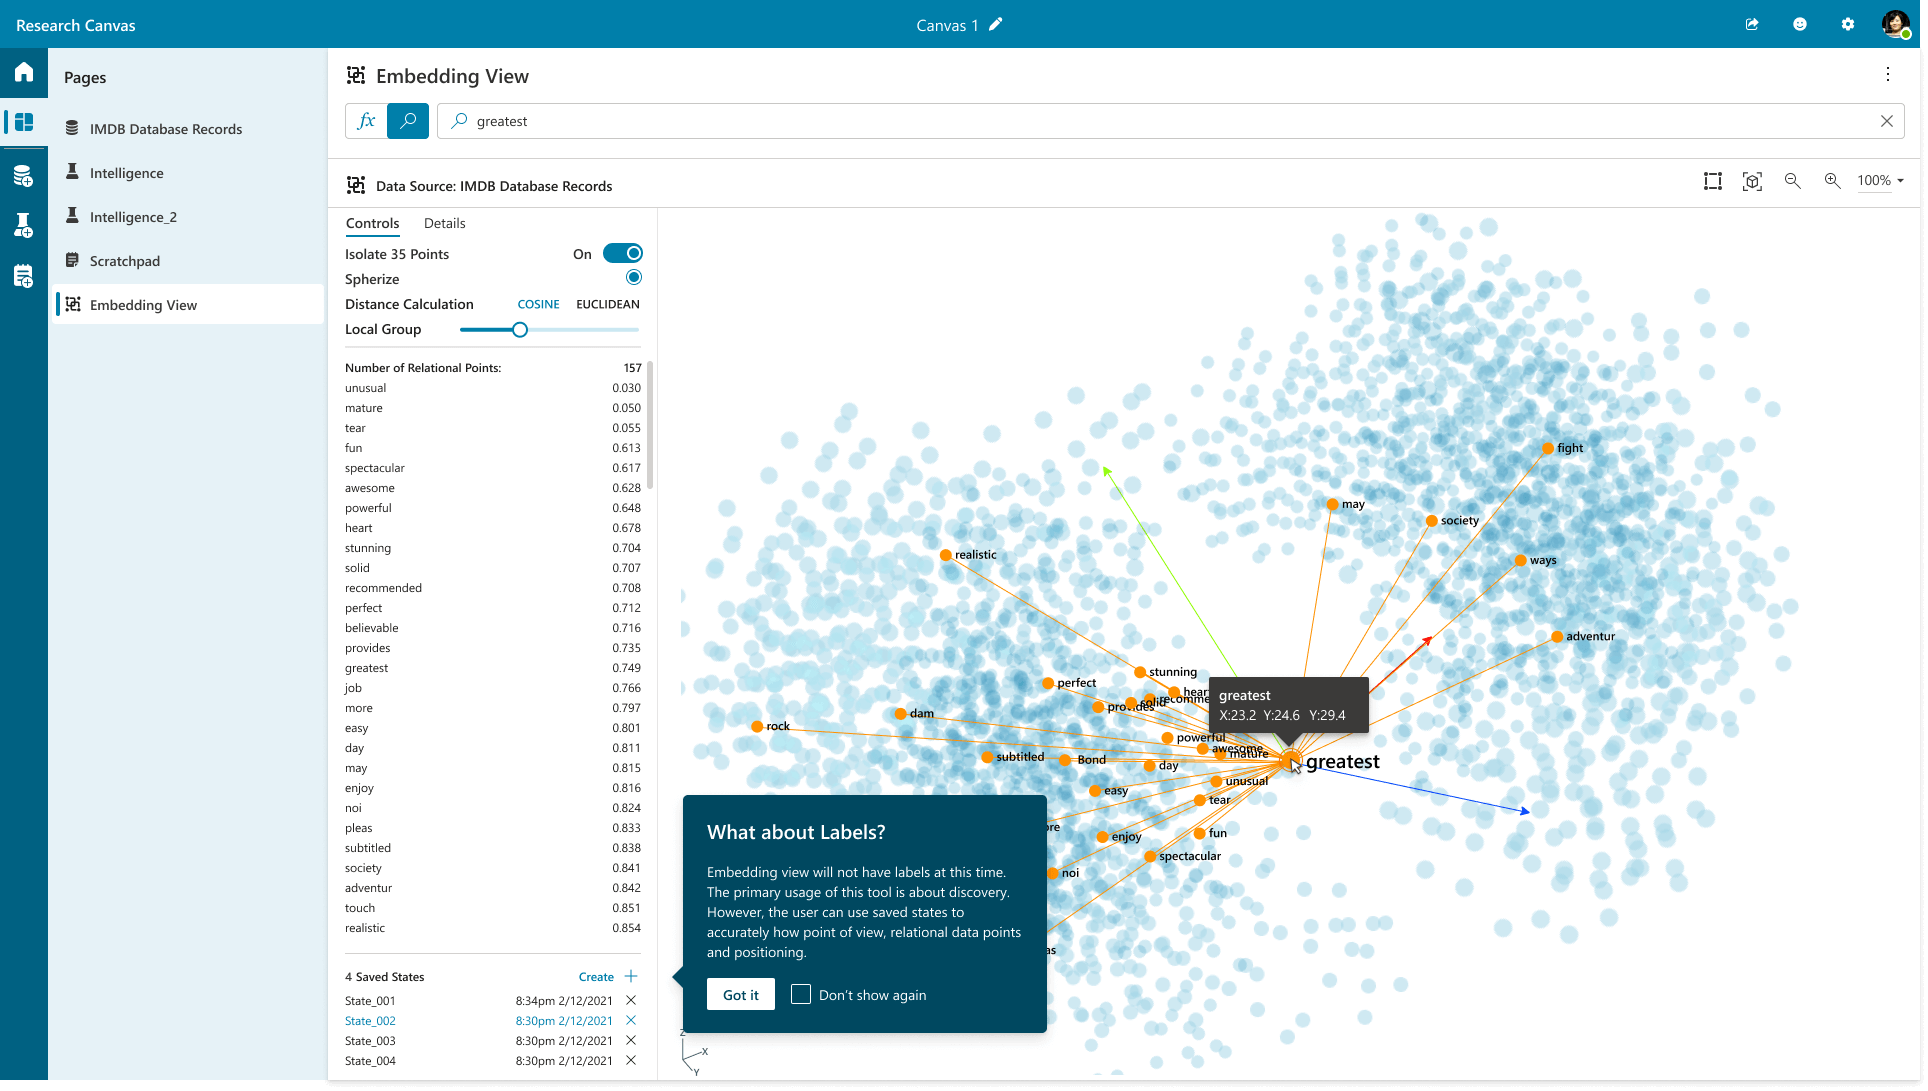
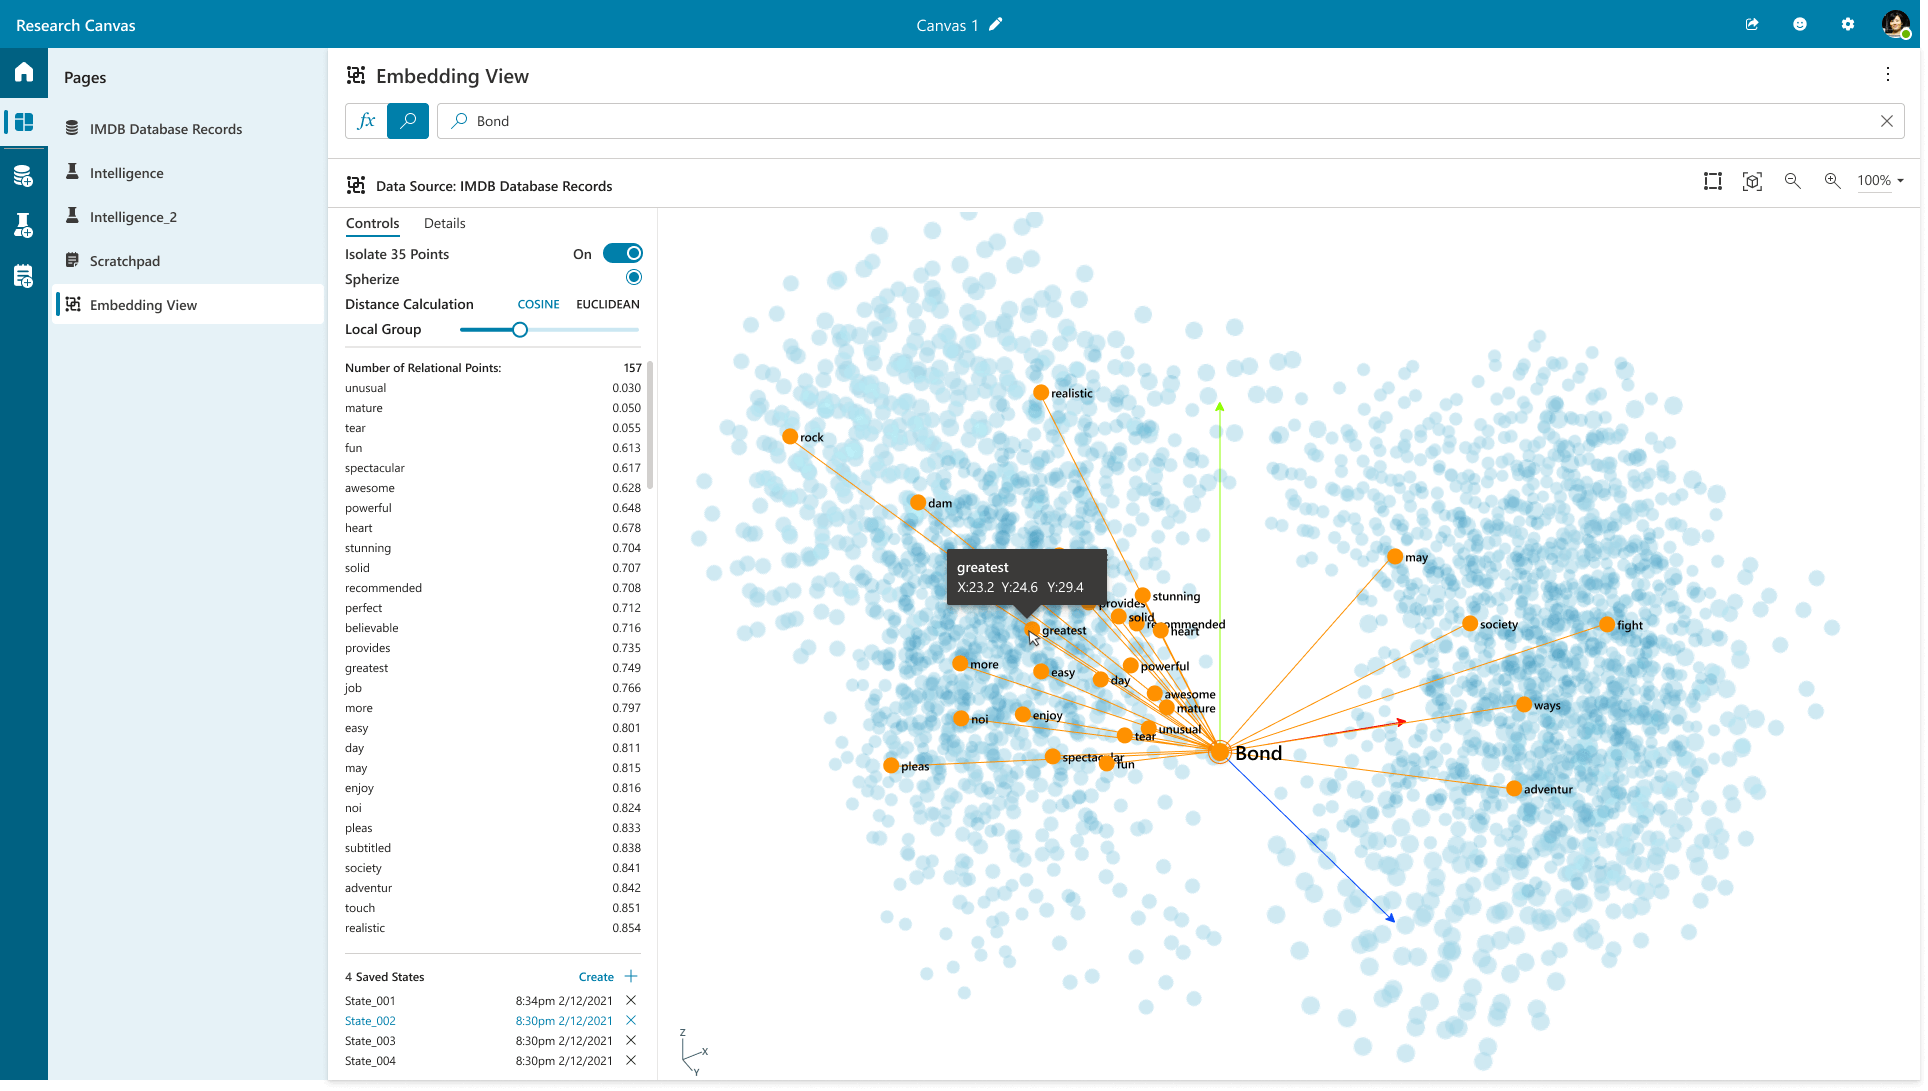
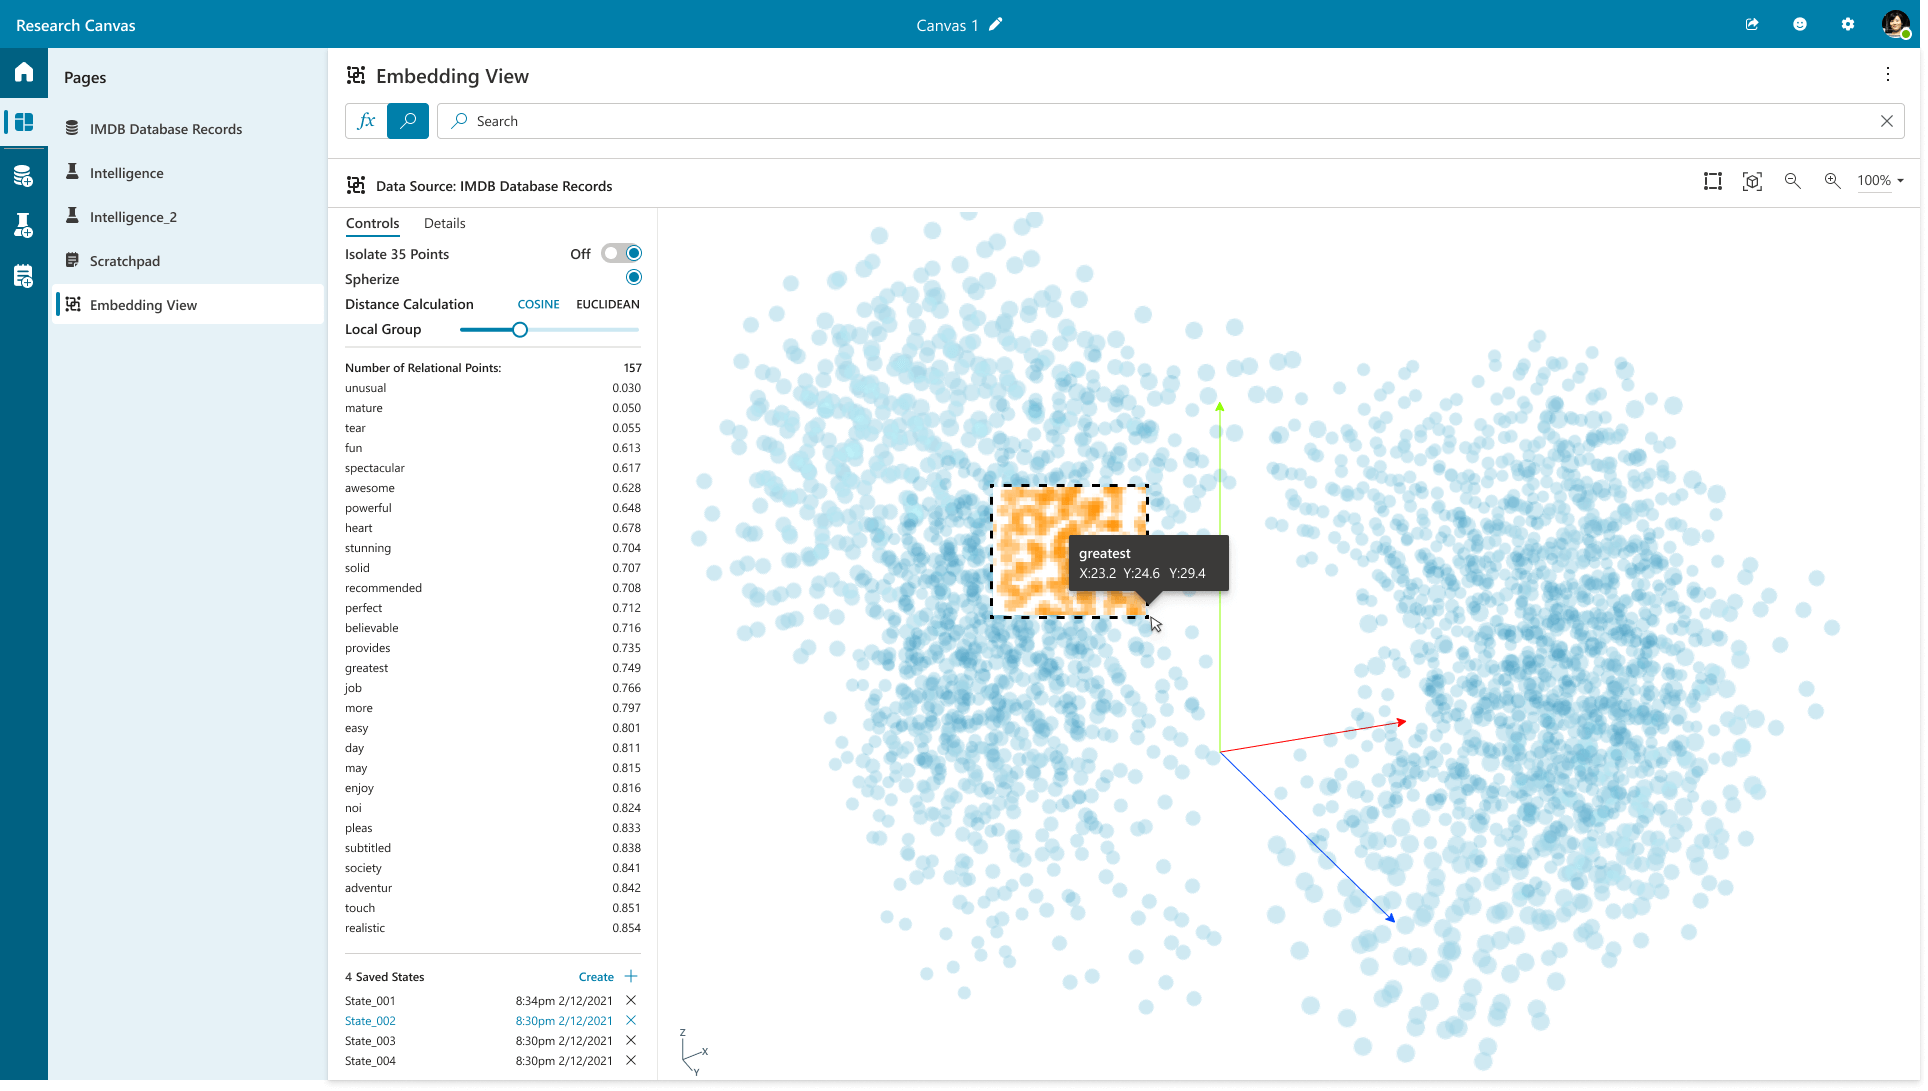
tensor Flows
Incorporating tensorFlow for data analysis within platforms like Research Canvas significantly enhances the capabilities of raw data processing and visualization. tensorFlow, an open-source machine learning library developed by Google, allows for sophisticated modeling and analysis of complex datasets through deep learning techniques. By integrating tensorFlow, Research Canvas can leverage advanced algorithms to perform predictive analytics, pattern recognition, and anomaly detection on vast amounts of data.
For instance, researchers can use tensorFlow to build neural networks that identify trends in historical data, making it easier to forecast future behaviors or outcomes. This capability is especially valuable in fields such as healthcare, where tensorFlow can analyze patient data to predict disease progression or treatment efficacy. Additionally, incorporating tensorFlow allows for the generation of dynamic and interactive visualizations that represent complex model outputs, enabling users to explore data-driven insights in an intuitive manner.
Moreover, tensorFlow’s flexibility facilitates the development of specialized models tailored to specific research needs, ensuring that users can delve deeper into their datasets. By integrating tensorFlow within the Research Canvas platform, users gain access to powerful machine learning tools that transform raw data into actionable insights, ultimately fostering a more informed and data-driven decision-making process across research disciplines.


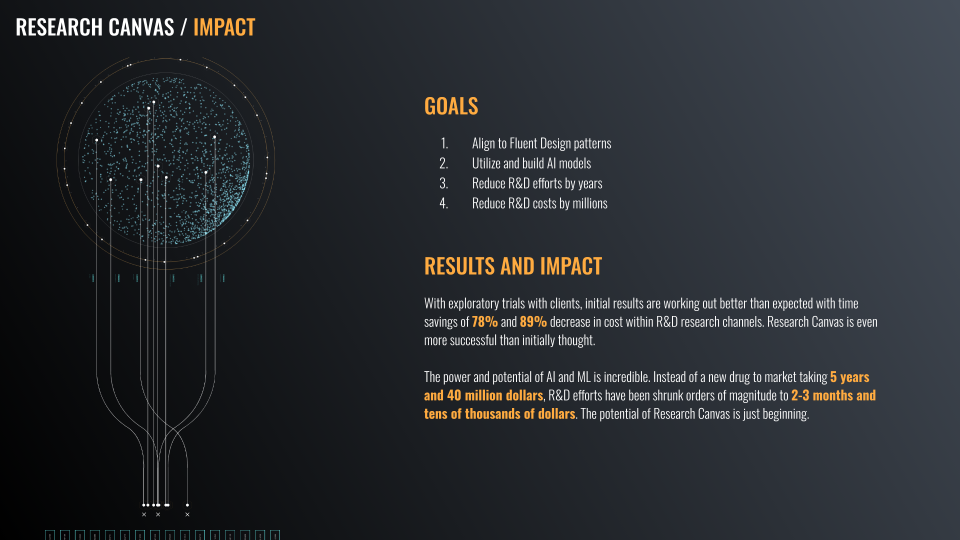
End Result
With exploratory trials with clients, initial results are working out better than expected with time savings of 78% and 89% decrease in cost within R&D research channels. Research Canvas is even more successful than initially thought.
The power and potential of AI and ML is incredible. Instead of a new drug to market taking 5 years and 40 million dollars, R&D efforts have been shrunk orders of magnitude to 2-3 months and tens of thousands of dollars. The potential of Research Canvas is just beginning.

Chad Rawlinson
Product Designer
Microsoft AI Research & Strategy
"As a designer, my experience working on Research Canvas has been profoundly transformative, fostering significant growth in my skills and understanding of user experience principles. Throughout the project, I deepened my knowledge of how to effectively translate complex technical concepts into user-friendly designs, which was essential for creating intuitive interfaces for researchers dealing with vast datasets. Collaborating with cross-functional teams, I gained insights into the importance of stakeholder feedback and iterative design processes, learning how to incorporate user input to refine and enhance the platform.
Working with advanced technologies like tensorFlow for data visualizations taught me the value of grounding design in data-driven decision-making, enabling me to create not only visually appealing graphics but also functional representations that convey meaningful insights. Additionally, aligning with Fluent UI patterns enhanced my appreciation for consistency and accessibility in design, reinforcing the impact of cohesive user interfaces on overall user satisfaction. This project has not only expanded my technical toolkit in areas such as data visualization, prototyping, and usability testing but also deepened my empathy for users, fostering a design mindset that prioritizes the needs and experiences of researchers in their quest for knowledge discovery."